【MIT CS6.828】Lab 1: Booting a PC - Part 4: The Stack
Part 4: The Stack
1. 栈的初始化
练习 9. 确定内核初始化栈的位置,以及栈在内存中的确切位置。内核如何为其栈保留空间?栈指针初始化后指向这个保留区域的哪一“端”?
内核运行的第一个工作是开启虚拟地址和物理地址之间的映射(或者说分页),第二个工作就是初始化栈。在kern/entry.S的relocated部分:
relocated:
	# Clear the frame pointer register (EBP)
	# so that once we get into debugging C code,
	# stack backtraces will be terminated properly.
	movl	$0x0,%ebp			# nuke frame pointer
	# 将栈底指针指向0x0

	movl	$(bootstacktop),%esp # mov   $0xf010f000,%esp
	# 将栈顶指针指向0xf010f000

	# now to C code
	call	i386_init
.data
###################################################################
# boot stack
###################################################################
	.p2align	PGSHIFT		# force page alignment
	.globl		bootstack
bootstack:
	.space		KSTKSIZE
	.globl		bootstacktop
bootstacktop:
其中KSTKSIZE = (8*PGSIZE) = 8 * 4096,故栈的大小为32KB,栈地址范围为0xf0107000到0xf010f000。
栈是从高地址向低地址方向增长的,所以栈顶指针(esp, stack pointer)指向这个保留区域的高地址一端。
2. 栈帧
练习 10. 为了熟悉 x86 上的 C 调用约定,在obj/kern/kernel.asm中找到函数test_backtrace的地址,在那里设置一个断点,并检查在内核启动后每次调用它时会发生什么。每层递归嵌套入栈有多少个32位字,这些字是什么?
2.1 使用 GDB 查看栈帧信息
-
打断点:
b *0xf0100040 -
运行到断点后执行
bt可以查看当前栈帧情况(即有多少次函数嵌套调用、都是哪些函数)(gdb) bt #0 test_backtrace (x=4) at kern/init.c:13 #1 0xf0100076 in test_backtrace (x=5) at kern/init.c:16 #2 0xf01000f4 in i386_init () at kern/init.c:39 #3 0xf010003e in relocated () at kern/entry.S:80上述显示信息表示
relocated()中调用了i386_init(),后者又调用了test_backtrace(),而后又进行了一次递归调用。#n表示栈帧号 -
查看
1号栈帧的相关信息:info f 1注:为什么
Stack frame at的值与eip的值不同?两者的值都代表当前栈帧的基地址,但 GDB 有它自己的想法,认为栈帧基地址应为eip+8。这里,我们采用Lab 2 讲义描述的栈帧范围,直接以
eip的值作为栈帧基地址,每个栈帧(当前栈帧除外)的最后一个元素应为保存的旧eip值(即返回地址),如下所示:+------------+ | | arg 2 | \ +------------+ >- 前一个函数(caller)的栈帧 | arg 1 | / +------------+ | | ret %eip | / -> callee的返回地址 +============+ %ebp-> | saved %ebp | \ -> caller的栈帧基地址 +------------+ | | | | | local | \ | variables, | >- 当前函数(callee)的栈帧 | etc. | / | | | | | | %esp-> +------------+ /(gdb) info f 1 Stack frame at 0xf010efe0: eip = 0xf0100076 in test_backtrace (kern/init.c:16); # 下一步要执行的指令地址是0xf0100076 saved eip = 0xf01000f4 # 旧eip值 # callee的返回地址,即callee函数执行完毕后下一步应执行该地址的指令 called by frame at 0xf010f000, caller of frame at 0xf010efc0 # 上一个栈帧(2号栈帧)的基地址:0xf010f000。这也是初始化栈时指定的ebp的值,初始化栈完毕后立即开始执行i386_init()。 source language c. Arglist at 0xf010efd8, args: x=5 # 函数参数为x=5 Locals at 0xf010efd8, Previous frame's sp is 0xf010efe0 # 2号栈帧的栈顶地址为0xf010efe0 Saved registers: ebx at 0xf010efd0, ebp at 0xf010efd8, esi at 0xf010efd4, eip at 0xf010efdc # 将ebx,ebp,esi,eip的值都保存在了栈中
2.2 栈的分析
将test_backtrace递归到参数x=0为止,查看栈帧情况:
(gdb) bt
#0  test_backtrace (x=0) at kern/init.c:13
#1  0xf0100076 in test_backtrace (x=1) at kern/init.c:16
#2  0xf0100076 in test_backtrace (x=2) at kern/init.c:16
#3  0xf0100076 in test_backtrace (x=3) at kern/init.c:16
#4  0xf0100076 in test_backtrace (x=4) at kern/init.c:16
#5  0xf0100076 in test_backtrace (x=5) at kern/init.c:16
...
-
栈的一个元素为 4 字节长,故相邻元素之间地址相差
0x04。 -
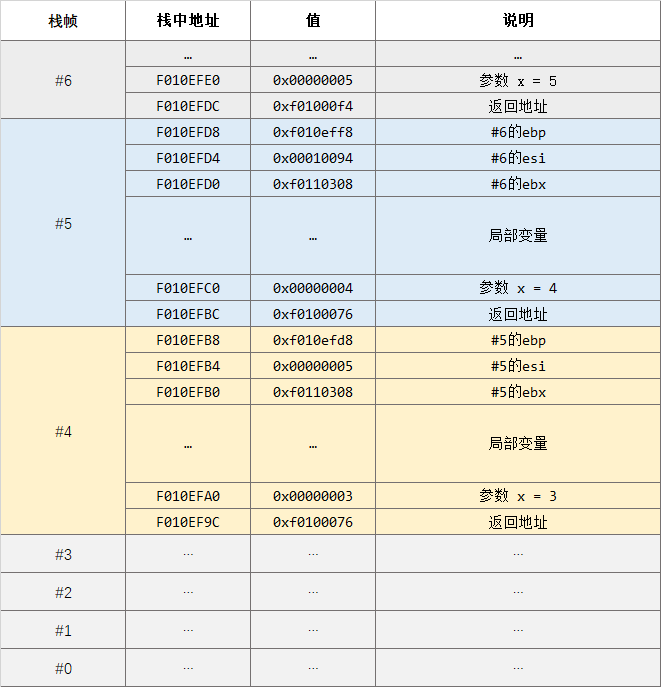
查看 #0 到 #5 各个栈帧
ebp的值,差值均为0x20,说明一个test_backtrace函数的栈帧大小为 32 字节,即 8 个栈元素. -
此时栈的情况如下图所示:
2.3 实现 mon_backtrace 函数
练习 11. 实现kern/monitor.c中的mon_backtrace函数。可参考inc/x86.h中的read_ebp()(但调用它可能会发生奇怪的问题)。要求该函数按以下格式输出栈帧信息:
Stack backtrace:
  ebp f0109e58  eip f0100a62  args 00000001 f0109e80 f0109e98 f0100ed2 00000031
  ebp f0109ed8  eip f01000d6  args 00000000 00000000 f0100058 f0109f28 00000061
  ...
其中第一行代表当前正在执行的函数,即mon_backtrace本身,第二行为调用mon_backtrace的函数,以此类推,需要打印所有未完成的栈帧。查看kern/entry.S来确定如何判断何时停止打印。
输出的参数值固定为 5 个,但这里并非全部都是有用的。
显然要求打印的这些值在栈中全都有,所以只要按照前文图中的地址规律来确定要访问的元素所在的地址即可(注意当前栈帧的参数位于比当前ebp更高的位置)。
int
mon_backtrace(int argc, char **argv, struct Trapframe *tf)
{
	uint32_t *ebp, eip;
	cprintf("Stack backtrace:\n");
	ebp = (unsigned int *)read_ebp();
	while(ebp != 0x0){
		eip = *(ebp+1);
		cprintf("ebp %8x eip %8x args ", ebp, eip);
		cprintf("%08x %08x %08x %08x %08x\n", *(ebp+2), *(ebp+3), *(ebp+4), *(ebp+5), *(ebp+6));
		ebp  = (uint32_t*) *ebp;
		// 切换到上一层栈帧
	}
	return 0;
}
要点:
*ebp是取出ebp地址中的值,这个值是上一层栈帧的ebp;ebp才是本层栈帧的ebp;- 最后打印的栈帧是
i386_init的栈帧,它的ebp是0xf10fff8,*ebp是0x0.
2.4 符号表与改进mon_backtrace
练习 11 实现的mon_backtrace可以打印栈帧的栈基址、返回地址和 5 个参数,但我们还想打印文件名、行号及所涉及的函数名,这需要使用符号表。
kern/kdebug.c中的debuginfo_eip()函数已经实现了根据eip查找对应文件名、函数名及行号的功能,其中用到了名称形如__STAB_*的结构体,这就是与符号表关联的部分。
符号表是编译原理课程中的概念,这里不多介绍,我们只需要知道符号表是如何载入 JOS 的。
(TODO:可能需要多少懂点编译原理才行……)
练习 12.
1. 在kern/kdebug.c中的debuginfo_eip()函数中插入stab_binsearch,使它能够找到对应eip的行号。
根据注释中的提示,在inc/stab.h找到代表行号的类型:
#define N_SLINE 0x44 // text segment line number
函数中其他部分已经实现了找文件、找函数的功能,都用到了stab_binsearch,由函数注释可知这是个二分查找函数,则若查找成功,下标为lline。所以查行号的代码为:
stab_binsearch(stabs, &lline, &rline, N_SLINE, addr);
if(lline == 0){
    return -1;
}
else{
    info->eip_line = stabs[lline].n_desc;
}
2. 修改mon_backtrace函数,调用debuginfo_eip(),以显示每个eip的函数名、源文件名和对应于该eip的行号。要求将该函数添加到控制台命令中,使用户能够通过输入backtrace命令执行该函数,格式如下所示:
K> backtrace
Stack backtrace:
  ebp f010ff78  eip f01008ae  args 00000001 f010ff8c 00000000 f0110580 00000000
         kern/monitor.c:143: monitor+106
  ebp f010ffd8  eip f0100193  args 00000000 00001aac 00000660 00000000 00000000
         kern/init.c:49: i386_init+59
  ebp f010fff8  eip f010003d  args 00000000 00000000 0000ffff 10cf9a00 0000ffff
         kern/entry.S:70: <unknown>+0
K>
修改commands:
static struct Command commands[] = {
	{ "help", "Display this list of commands", mon_help },
	{ "kerninfo", "Display information about the kernel", mon_kerninfo },
	{ "backtrace", "Display information about the stack frames", mon_backtrace },
};
然后修改mon_backtrace:
int
mon_backtrace(int argc, char **argv, struct Trapframe *tf)
{
	uint32_t *ebp, eip;
	cprintf("Stack backtrace:\n");
	ebp = (unsigned int *)read_ebp();
	while( ebp != 0x0 ){
		eip = *(ebp+1);
		cprintf("ebp %08x eip %08x args ", ebp, eip);
		cprintf("%08x %08x %08x %08x %08x\n", *(ebp+2), *(ebp+3), *(ebp+4), *(ebp+5), *(ebp+6));
		struct Eipdebuginfo info;
		debuginfo_eip(eip, &info);
		cprintf("\t%s:%d: ", info.eip_file, info.eip_line);
		cprintf("%.*s", info.eip_fn_namelen, info.eip_fn_name);
		// info.eip_fn_name不以'\0'结尾,所以要用%.*s输出
		cprintf("+%u\n", eip - info.eip_fn_addr);
		ebp  = (uint32_t*) *ebp;
		// 切换到上一层栈帧
	}
	return 0;
}
输出如下:
Stack backtrace:
ebp f010ff18 eip f01000a1 args 00000000 00000000 00000000 f010004a f0111308
             kern/init.c:18: test_backtrace+97
ebp f010ff38 eip f0100076 args 00000000 00000001 f010ff78 f010004a f0111308
             kern/init.c:16: test_backtrace+54
ebp f010ff58 eip f0100076 args 00000001 00000002 f010ff98 f010004a f0111308
             kern/init.c:16: test_backtrace+54
ebp f010ff78 eip f0100076 args 00000002 00000003 f010ffb8 f010004a f0111308
             kern/init.c:16: test_backtrace+54
ebp f010ff98 eip f0100076 args 00000003 00000004 00000000 f010004a f0111308
             kern/init.c:16: test_backtrace+54
ebp f010ffb8 eip f0100076 args 00000004 00000005 00000000 f010004a f0111308
             kern/init.c:16: test_backtrace+54
ebp f010ffd8 eip f01000f4 args 00000005 00001aac 00000660 00000000 00000000
             kern/init.c:39: i386_init+78
ebp f010fff8 eip f010003e args 00000003 00001003 00002003 00003003 00004003
             kern/entry.S:83: <unknown>+0
最后运行make grade检查各个练习的代码是否正确:
$ make grade
...
running JOS: (0.7s)
  printf: OK
  backtrace count: OK
  backtrace arguments: OK
  backtrace symbols: OK
  backtrace lines: OK
Score: 50/50
练习 12 的检查方式还是有点草率的,正则表达式匹配,也就是说只要在该有数字的地方有个数字就行,所以即使输出行号和实际行号完全不符合也有可能给OK……
Lab 1 至此全部完成。
参考资料
- 6.828: Operating System Engineering
- Lab 1: Booting a PC
- Wikipedia: x86
- Wikipedia: "8042" PS/2 Controller
- XT, AT and PS/2 I/O port addresses
- Intel 80386 Reference Programmer's Manual Table of Contents - 4.1 Systems Registers
- Wikipedia: GDT Tutorial
- WikiPedia: Executable and Linkable Format
- C语言中可变参数函数实现原理

 浙公网安备 33010602011771号