

echarts 使用极坐标+柱形图实现多重环形
效果图
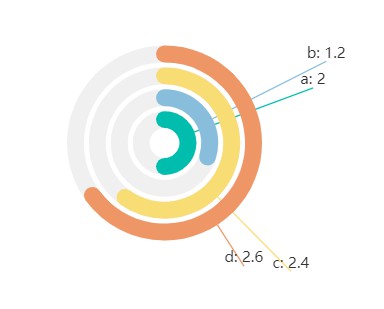
代码:
<template>
  <div>
    <div id="chart2" />
  </div>
</template>
<script setup>
import * as echarts from "echarts";
import { onMounted } from "vue";

onMounted(() => {
  var myChart2 = echarts.init(document.getElementById("chart2"));

  myChart2.setOption({
    title: {
      text: "销售分布",
    },
    tooltip: {},
    legend: {
      data: ["一月", "二月", "三月"],
    },
    polar: {
      radius: ["5%", "40%"],
      //   center: ["50%", "50%"],
    },
    angleAxis: {
      max: 4,
      startAngle: 90,
      axisLine: {
        show: false,
      },
      axisTick: {
        show: false,
      },
      axisLabel: {
        show: false,
      },
      splitLine: {
        show: false,
      },
    },
    radiusAxis: {
      type: "category",
      data: ["a", "b", "c", "d"],
      axisLabel: {
        show: false,
      },
      axisTick: {
        show: false,
      },
      splitLine: {
        show: false,
      },
      axisLine: {
        show: false,
      },
    },
    series: {
      type: "bar",
      showBackground: true, // 展示背景阴影
      colorBy: "data",
      barCategoryGap: 4, // 柱形间距
      color: ["#00BDAE", "#88bedb", "#f8dc74", "#ee9665"],
      data: [
        2,
        1.2,
        {
          value: 2.4,
          label: {
            offset: [50, 80],
            rotate: 0,
          },
        },
        {
          value: 2.6,
          label: {
            offset: [0, 60],
          },
        },
      ],
      roundCap: true,
      coordinateSystem: "polar",
      label: {
        show: true,
        position: "middle",
        formatter: "{b}: {c}",
        offset: [100, -50],
        rotate: 0,
      },
      labelLine: {
        show: true,
      },
    },
  });
});
</script>

<style scoped>
#chart2 {
  width: 500px;
  height: 400px;
}
</style>
这个实现的优点是,阴影部分是真正的阴影,不用额外配置鼠标移入的高亮效果
有个问题是如果要展示 label,需要自己调整偏移位置,默认是放在柱图中间的

 浙公网安备 33010602011771号