SprintBoot + Prometheus 添加接口监控功能
范例项目代码地址:https://gitee.com/teseven/demo-prometheus
1.添加引用
     <dependency>
            <groupId>org.springframework.boot</groupId>
            <artifactId>spring-boot-starter-actuator</artifactId>
        </dependency>
        <dependency>
            <groupId>io.micrometer</groupId>
            <artifactId>micrometer-registry-prometheus</artifactId>
            <version>1.10.1</version>
        </dependency>
2.设置metrics启动地址
management:
  endpoints:
    web:
      exposure:
        include: 'prometheus'
      base-path: '/metrics'
3.接口添加统计监控逻辑
这里我们使用 demo.test.count 作为统计项的名称,每调用一次接口统计值递增。
package com.example.prometheusdemo.controller;

import io.micrometer.core.instrument.Metrics;
import org.springframework.web.bind.annotation.GetMapping;
import org.springframework.web.bind.annotation.RequestMapping;
import org.springframework.web.bind.annotation.RestController;

@RestController
@RequestMapping("test")
public class TestController {

    @GetMapping("counter")
    public String count() {
        Metrics.counter("demo.test.counter").increment();
        return "success";
    }
}
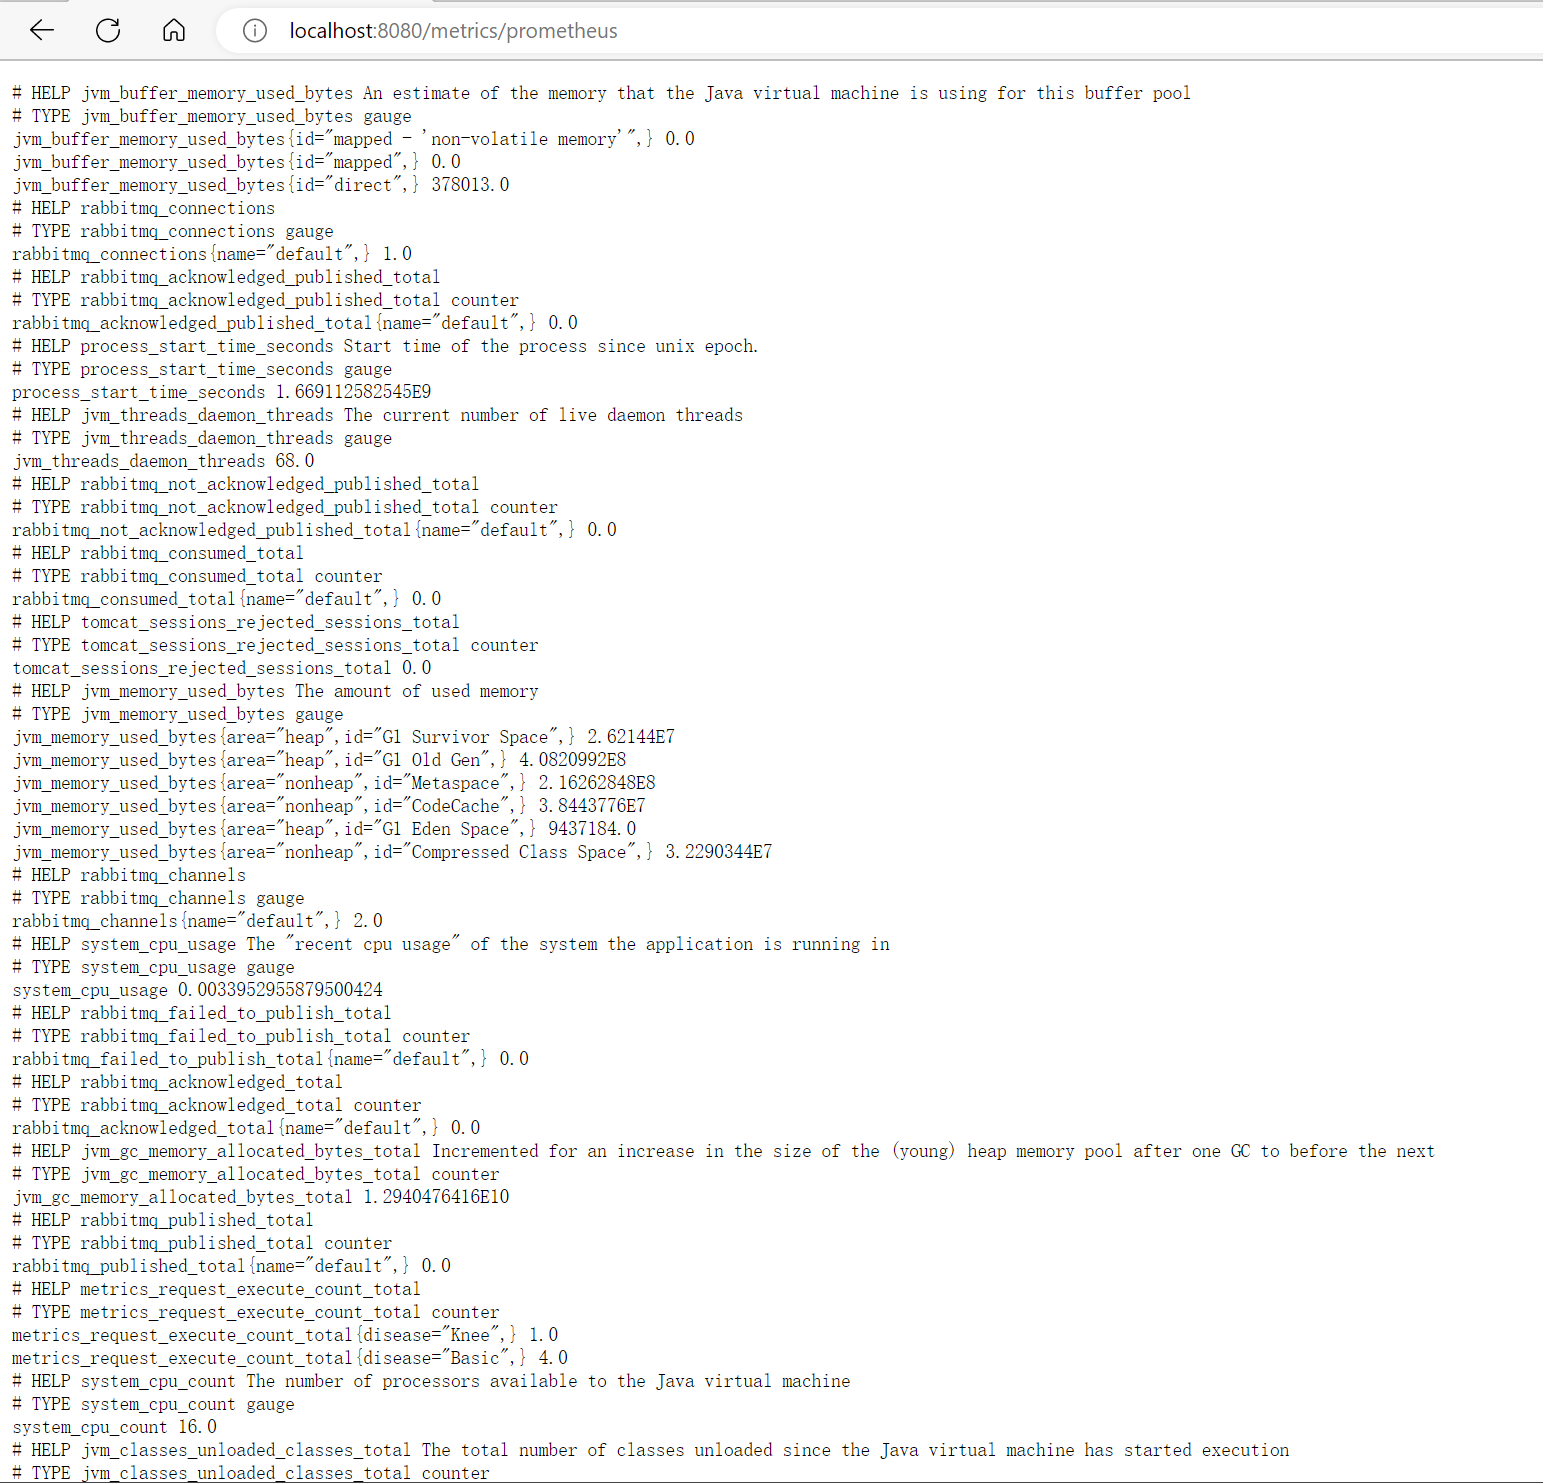
4.启动SprintBoot查看统计值是否正常
启动后浏览器打开:localhost:8080/metrics/prometheus,就能正常看到一些统计数据了。
5.docker镜像启动prometheus
服务发布成功后,prometheus需要周期性的调用服务的地址获取数据,因此我修改了一下prometheus原版本的镜像,把服务地址简单放到了环境变量里面,只需要配置TARGET环境变量既可。
docker run -d --name mytest -p 9090:9090 -e TARGET={服务器地址} eseven/prometheus:2.40.2.0
镜像启动成功后,直接本地输入http://localhost:9090
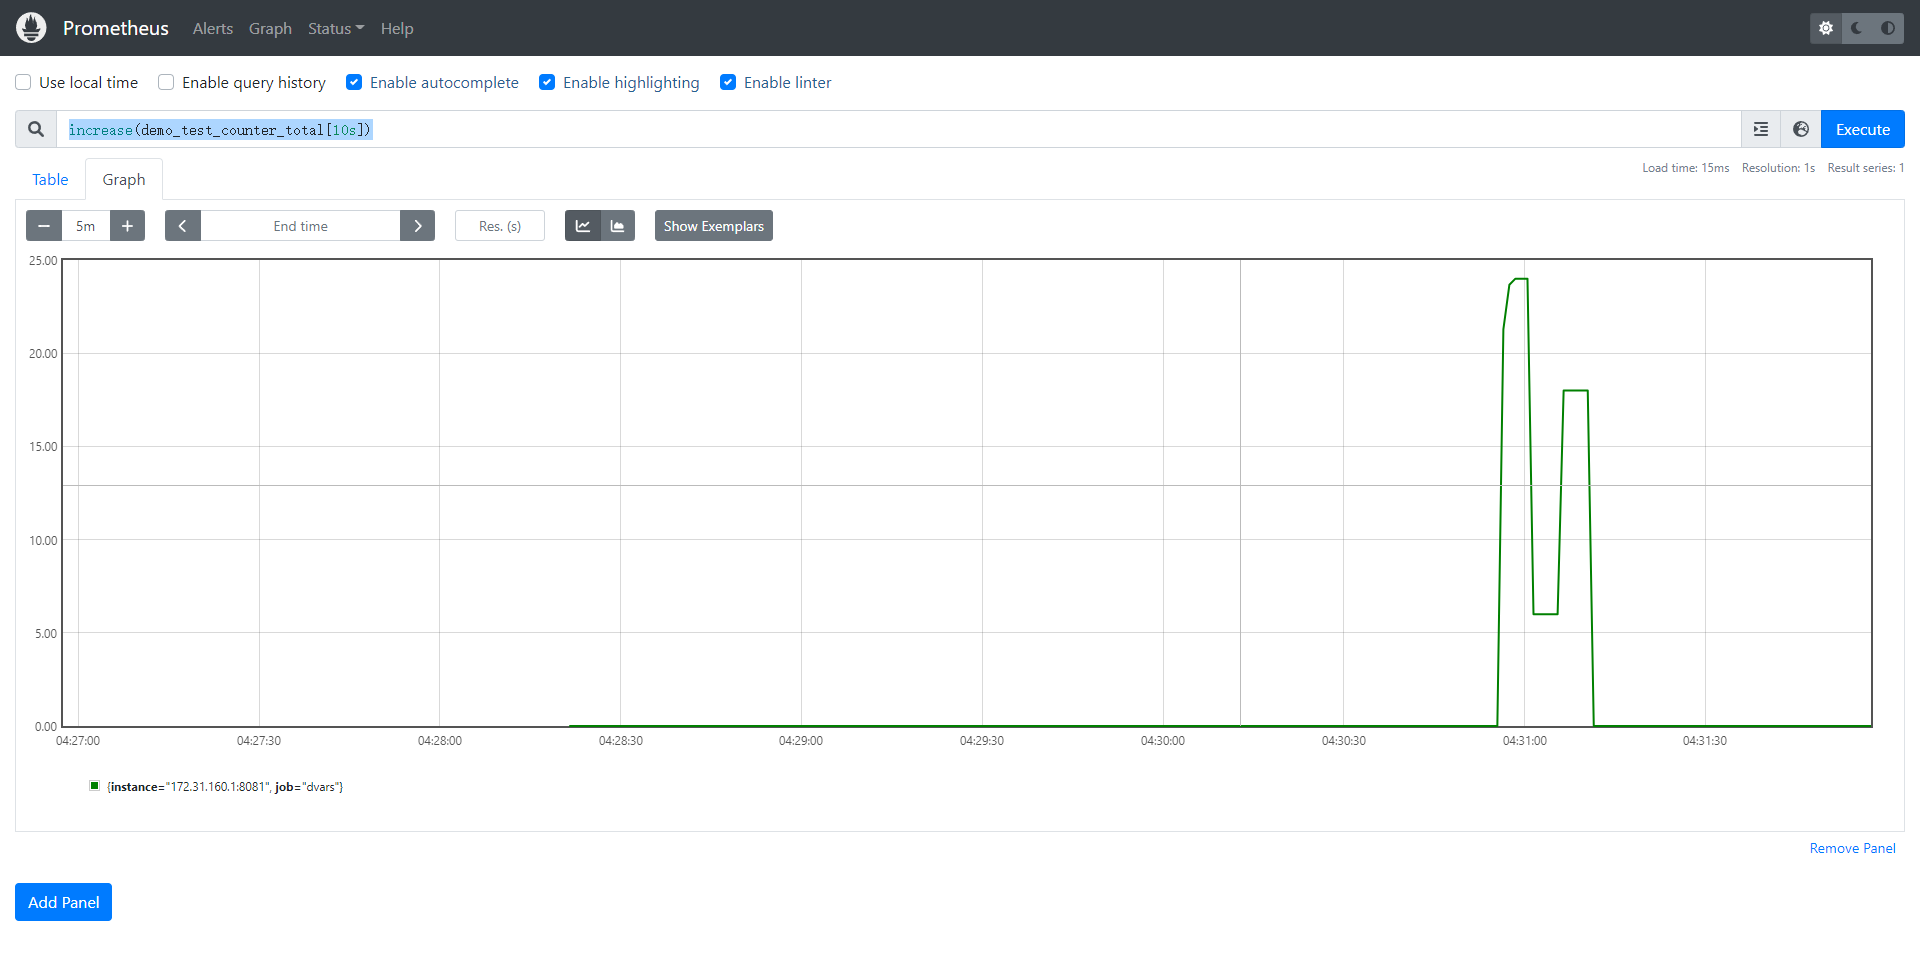
6. 配置10s接口调用次数
increase(demo_test_counter_total[10s])
效果如下:

 浙公网安备 33010602011771号