WPF调用Winform Chart控件绘图
最近在研究WPF,需要用到类似Chart的控件来绘制折线图,横坐标自定义时间信息。先后研究了DynamicDataDisplay.ChartPlotter、Toolkit,因为WPF用的人太少了,这方面可以查到的资料太少了。DynamicDataDisplay.ChartPlotter虽然能实现横坐标显示时间,但是我想显示的是历史的时间信息,非当下时间,遂弃之。如果有知道的大神,可以提点下我怎么改。
以上种种,导致我想用熟悉的Winform下的Chart来绘制。
1.首先添加引用
System.Windows.Forms.dll
WindowsFormsIntegration.dll
System.Windows.Forms.DataVisualization.dll
2..xaml添加命名空间
    xmlns:wfi="clr-namespace:System.Windows.Forms.Integration;assembly=WindowsFormsIntegration"
    xmlns:wf="clr-namespace:System.Windows.Forms;assembly=System.Windows.Forms"
    xmlns:Chr="clr-namespace:System.Windows.Forms.DataVisualization.Charting;assembly=System.Windows.Forms.DataVisualization"
3.WPF是不可以直接引用WinForm Chart,但可以托管在WindowsFormsHost中使用,所以我们要添加一个宿主容器。
     <WindowsFormsHost x:Name="WFHost_HistoryFlow" Margin="1">
         <Chr:Chart x:Name="Chart_HistoryFlow" GetToolTipText="Chart_HistoryFlow_GetToolTipText" BackColor="WhiteSmoke" MouseWheel="Chart_HistoryFlow_MouseWheel"/>
     </WindowsFormsHost>
4.后台代码.cs添加命名空间
using System.Windows.Forms;
using System.Windows.Forms.DataVisualization.Charting;
5.后台代码
5.1私有变量
DataTable dataTable = new DataTable();
5.2 初始化
 /// <summary>
        /// 設定Chart Control
        /// </summary>
        private void SetChart()
        {
            ChartArea ca = new ChartArea("ChartArea1");
            this.Chart_HistoryFlow.ChartAreas.Add(ca);
            ChartArea ca_Pres = new ChartArea("ChartArea1");
            this.Chart_HistoryPres.ChartAreas.Add(ca_Pres);
            ChartArea ca_Ratio = new ChartArea("ChartArea1");
            this.Chart_HistoryRatio.ChartAreas.Add(ca_Ratio);

            //Processor
            System.Windows.Forms.DataVisualization.Charting.Legend lgFlow = new System.Windows.Forms.DataVisualization.Charting.Legend("Legend1");
            lgFlow.IsTextAutoFit = true;
            lgFlow.Docking = Docking.Top;
            this.Chart_HistoryFlow.Legends.Add(lgFlow);

            System.Windows.Forms.DataVisualization.Charting.Legend lgPres = new System.Windows.Forms.DataVisualization.Charting.Legend("Legend1");
            lgPres.IsTextAutoFit = true;
            lgPres.Docking = Docking.Top;
            this.Chart_HistoryPres.Legends.Add(lgPres);

            System.Windows.Forms.DataVisualization.Charting.Legend lgRatio = new System.Windows.Forms.DataVisualization.Charting.Legend("Legend1");
            lgRatio.IsTextAutoFit = true;
            lgRatio.Docking = Docking.Top;
            this.Chart_HistoryRatio.Legends.Add(lgRatio);

            SetChartAutoBar(Chart_HistoryFlow);
            SetChartAutoBar(Chart_HistoryPres);
            SetChartAutoBar(Chart_HistoryRatio);
        }

        /// <summary>
        /// 设置折线图游标
        /// </summary>
        private void SetChartAutoBar(Chart chart)
        {
            //设置游标
            chart.ChartAreas[0].CursorX.IsUserEnabled = true;
            chart.ChartAreas[0].CursorX.AutoScroll = true;
            chart.ChartAreas[0].CursorX.IsUserSelectionEnabled = true;
            //设置X轴是否可以缩放
            chart.ChartAreas[0].AxisX.ScaleView.Zoomable = true;

            //将滚动内嵌到坐标轴中
            chart.ChartAreas[0].AxisX.ScrollBar.IsPositionedInside = true;
            // 设置滚动条的大小
            chart.ChartAreas[0].AxisX.ScrollBar.Size = 10;
            // 设置滚动条的按钮的风格,下面代码是将所有滚动条上的按钮都显示出来
            chart.ChartAreas[0].AxisX.ScrollBar.ButtonStyle = ScrollBarButtonStyles.All;
            // 设置自动放大与缩小的最小量
            chart.ChartAreas[0].AxisX.ScaleView.SmallScrollSize = double.NaN;
            chart.ChartAreas[0].AxisX.ScaleView.SmallScrollMinSize = 1;
        }
5.3 事件
        /// <summary>
        /// 历史流量折线图鼠标滚动 滚动条对应滑动 最小及最大数据位置停止
        /// </summary>
        /// <param name="sender"></param>
        /// <param name="e"></param>
        private void Chart_HistoryFlow_MouseWheel(object sender, System.Windows.Forms.MouseEventArgs e)
        {

            //按住Ctrl,缩放
            if ((System.Windows.Forms.Control.ModifierKeys & Keys.Control) == Keys.Control)
            {
                if (e.Delta < 0)
                    Chart_HistoryFlow.ChartAreas[0].AxisX.ScaleView.Size += 4;
                else
                    Chart_HistoryFlow.ChartAreas[0].AxisX.ScaleView.Size -= 4;
            }
            //不按Ctrl,滚动
            else
            {
                if (e.Delta < 0)
                {
                    //当前位置+视图长大于最大数据时停止
                    if (Chart_HistoryFlow.ChartAreas[0].AxisX.ScaleView.Position + Chart_HistoryFlow.ChartAreas[0].AxisX.ScaleView.Size < Chart_HistoryFlow.ChartAreas[0].AxisX.ScaleView.ViewMaximum)
                        Chart_HistoryFlow.ChartAreas[0].AxisX.ScaleView.Position += 4;
                }
                else
                {
                    //当前位置小于最小数据时停止
                    if (Chart_HistoryFlow.ChartAreas[0].AxisX.ScaleView.Position > Chart_HistoryFlow.ChartAreas[0].AxisX.ScaleView.ViewMinimum)
                        Chart_HistoryFlow.ChartAreas[0].AxisX.ScaleView.Position -= 4;
                }

            }
        }

        /// <summary>
        /// 流量脉冲折线图光标显示详细数据
        /// </summary>
        /// <param name="sender"></param>
        /// <param name="e"></param>
        private void Chart_HistoryFlow_GetToolTipText(object sender, System.Windows.Forms.DataVisualization.Charting.ToolTipEventArgs e)
        {
            if (e.HitTestResult.ChartElementType == ChartElementType.DataPoint)
            {
                this.Cursor = System.Windows.Input.Cursors.Cross;
                int i = e.HitTestResult.PointIndex;
                string time = this.dataTable.Rows[i]["时间"].ToString();
                string aFlow = this.dataTable.Rows[i]["A脉冲"].ToString();
                string bFlow = this.dataTable.Rows[i]["B脉冲"].ToString();
                string aPressure = this.dataTable.Rows[i]["A压力"].ToString();
                string bPressure = this.dataTable.Rows[i]["B压力"].ToString();
                string abRatio = this.dataTable.Rows[i]["AB比率"].ToString();
                e.Text = $"时  间:{time}\r\nA脉冲:{aFlow}\r\nB脉冲:{bFlow}\r\nA压力:{aPressure}\r\nB压力:{bPressure}\r\nAB比率:{abRatio}";
            }
            else
            {
                this.Cursor = System.Windows.Input.Cursors.Arrow;
            }
        }
5.4 往Chart中写入数据
        /// <summary>
        /// DataTable数据写入Chart中
        /// </summary>
        /// <param name="dataTable">包含数据的DataTable</param>
        /// <param name="chart">待写入数据的Chart</param>
        public void DataTableToChart(DataTable dataTable, Chart chart,string title, string series1, string series2)
        {
            chart.Series.Clear();   //清空图表中的内容
            chart.Titles.Clear();
            chart.Titles.Add(title);//添加标题
            chart.DataSource = dataTable;

            Series aCodeSeries = chart.Series.Add(series1);//添加第一个表
            aCodeSeries.ChartType = SeriesChartType.Line;//设为折线图显示
            aCodeSeries.YValueMembers = series1;//y轴为数据
            aCodeSeries.XValueMember = "时间";
            Series bCodeSeries = chart.Series.Add(series2);//添加第二个表
            bCodeSeries.ChartType = SeriesChartType.Line;//设为折线图显示
            bCodeSeries.YValueMembers = series2;
        }
往DataTable中写点数据,我的列名为"时间","A脉冲","B脉冲","A压力","B压力","AB比率"。
5.5显示效果
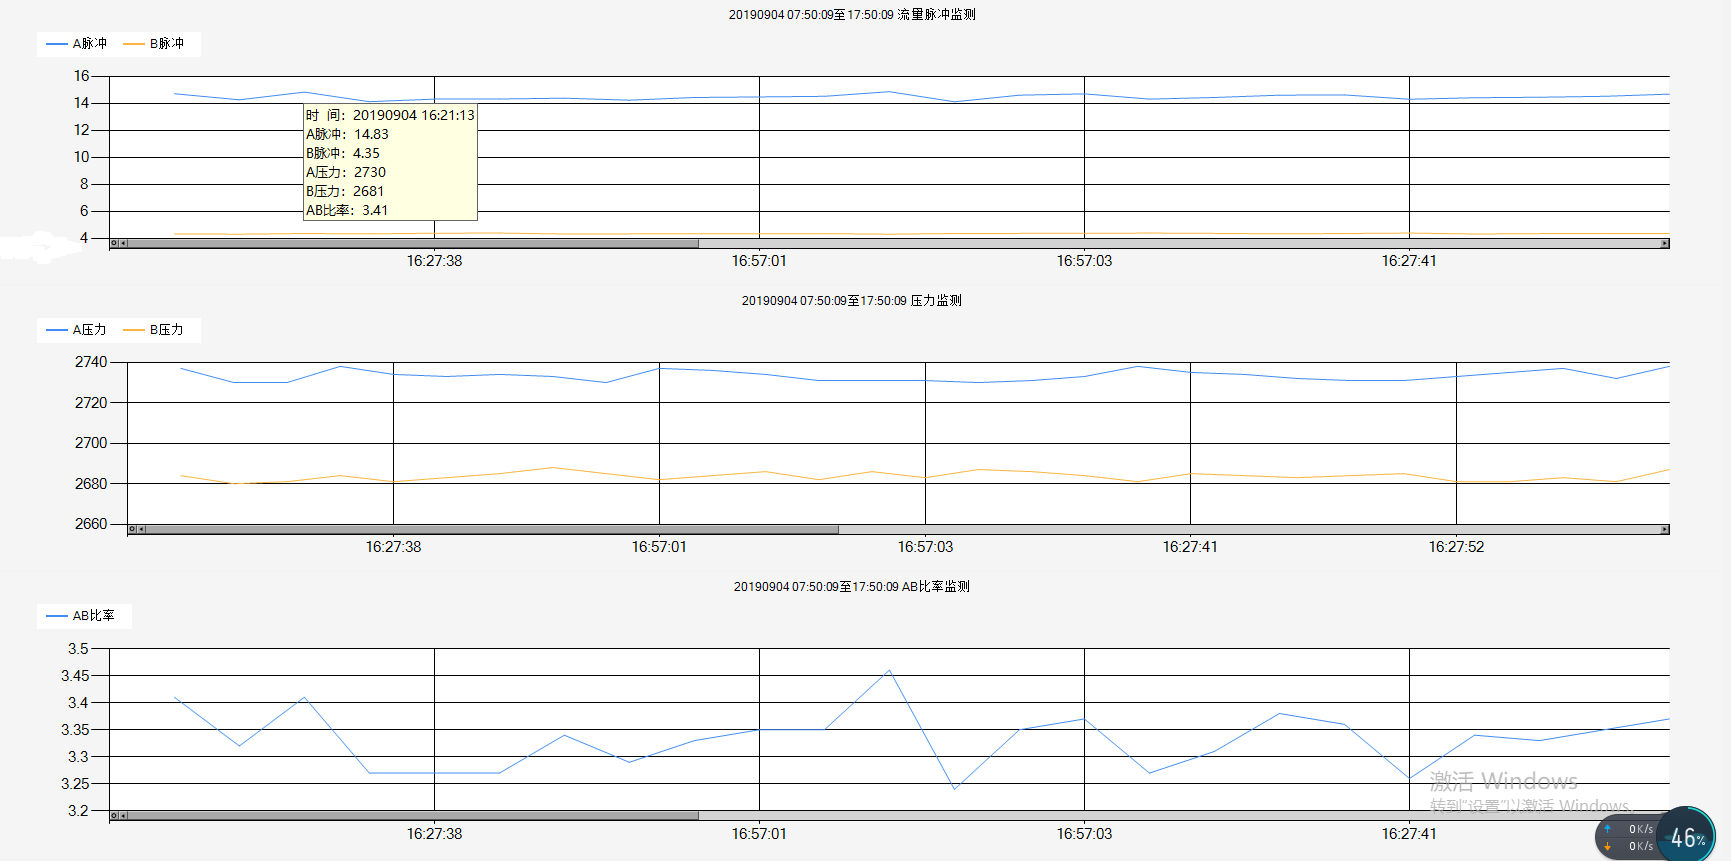
OVER~撒花

 浙公网安备 33010602011771号