用scatter展示数据特征
见https://matplotlib.org/devdocs/api/_as_gen/matplotlib.pyplot.scatter.html
matplotlib.pyplot.scatter(x, y, s=None, c=None, marker=None, cmap=None, norm=None, vmin=None, vmax=None, alpha=None, linewidths=None, verts=None, edgecolors=None, hold=None, data=None, **kwargs)
原文summarize的很好:
- Make a scatter plot of
xvsy. - Marker size is scaled by
sand marker color is mapped toc。
我的应用案例
import matplotlib.pyplot as plt
from matplotlib.colors import ListedColormap
plt.figure()
plt.title('Sample regression problem with one input variable')
#黄绿蓝
cmap_bold = ListedColormap(['#FFFF00', '#00FF00', '#0000FF'])
plt.scatter(XTrain[:,0], XTrain[:,1], c=yTrain,marker= 'o', s=50, cmap=cmap_bold)
plt.show()
结果显示
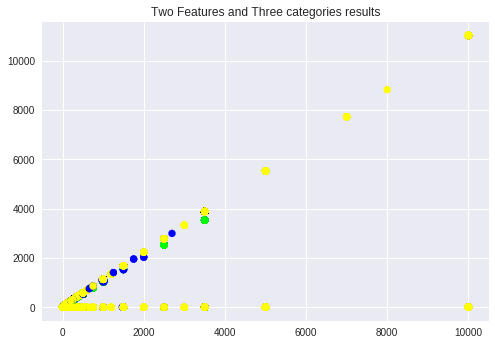
plot的目的是想通过数据观察特征,选取特征,之后还会进行更多对特征的分析

 浙公网安备 33010602011771号