

Echarts 定时循环显示tooltip
视频演示
注*:加外部iframe标签不显示 把网址放在了下面 复制后浏览器打开
https://www.bilibili.com/video/BV1qG9jY7E63/?share_source=copy_web&vd_source=48c2647881db236a77ca676a2ae5ee51
组件 tooltip-auto-show-vue.js
/**

* echarts tooltip轮播

* @param chart ECharts实例

* @param chartOption echarts的配置信息

* @param options object 选项

* {

*  interval    轮播时间间隔,单位毫秒,默认为2000

*  loopSeries  boolean类型,默认为false。

*              true表示循环所有series的tooltip,false则显示指定seriesIndex的tooltip

*  seriesIndex 默认为0,指定某个系列(option中的series索引)循环显示tooltip,

*              当loopSeries为true时,从seriesIndex系列开始执行。

*  updateData  自定义更新数据的函数,默认为null;

*              用于类似于分页的效果,比如总数据有20条,chart一次只显示5条,全部数据可以分4次显示。

* }

* @returns {{clearLoop: clearLoop}|undefined}

*/

export function loopShowTooltip(chart, chartOption, options,callback) {

    let defaultOptions = {

        interval: 2000,

        loopSeries: false,

        seriesIndex: 0,

        updateData: null,

    };

    if (!chart || !chartOption) {
        return;
    }

    let dataIndex = 0; // 数据索引,初始化为-1,是为了判断是否是第一次执行

    let seriesIndex = 0; // 系列索引

    let timeTicket = 0;

    let seriesLen = chartOption.series.length; // 系列个数

    let dataLen = 0; // 某个系列数据个数

    let chartType; // 系列类型

    let first = true;

    let lastShowSeriesIndex = 0;

    let lastShowDataIndex = 0;

    if (seriesLen === 0) {

        return;

    }

    // 待处理列表

    // 不循环series时seriesIndex指定显示tooltip的系列,不指定默认为0,指定多个则默认为第一个

    // 循环series时seriesIndex指定循环的series,不指定则从0开始循环所有series,指定单个则相当于不循环,指定多个

    // 要不要添加开始series索引和开始的data索引?

    if (options) {

        options.interval = options.interval || defaultOptions.interval;

        options.loopSeries = options.loopSeries || defaultOptions.loopSeries;

        options.seriesIndex = options.seriesIndex || defaultOptions.seriesIndex;

        options.updateData = options.updateData || defaultOptions.updateData;

    } else {

        options = defaultOptions;

    }

    // 如果设置的seriesIndex无效,则默认为0

    if (options.seriesIndex < 0 || options.seriesIndex >= seriesLen) {

        seriesIndex = 0;

    } else {

        seriesIndex = options.seriesIndex;

    }

    /**

    * 清除定时器

    */

    function clearLoop() {

        if (timeTicket) {

            clearInterval(timeTicket);

            timeTicket = 0;

        }

        chart.off('mousemove', stopAutoShow);

        zRender.off('mousemove', zRenderMouseMove);

        zRender.off('globalout', zRenderGlobalOut);

    }

    /**

    * 取消高亮

    */

    function cancelHighlight() {

        /**

        * 如果dataIndex为0表示上次系列完成显示,如果是循环系列,且系列索引为0则上次是seriesLen-1,否则为seriesIndex-1;

        * 如果不是循环系列,则就是当前系列;

        * 如果dataIndex>0则就是当前系列。

        */

        let tempSeriesIndex =

            dataIndex === 0

                ? options.loopSeries

                    ? seriesIndex === 0

                        ? seriesLen - 1

                        : seriesIndex - 1

                    : seriesIndex

                : seriesIndex;

        let tempType = chartOption.series[tempSeriesIndex].type;


        if (tempType === 'pie' || tempType === 'radar' || tempType === 'map') {

            chart.dispatchAction({

                type: 'downplay',

                seriesIndex: lastShowSeriesIndex,

                dataIndex: lastShowDataIndex,

            }); // wait 系列序号为0且循环系列,则要判断上次的系列类型是否是pie、radar

        }

    }

    /**

    * 自动轮播tooltip

    */

    function autoShowTip() {

        let invalidSeries = 0;

        let invalidData = 0;

        function showTip() {

            // chart不在页面中时,销毁定时器

            let dom = chart.getDom();

            if (document !== dom && !document.documentElement.contains(dom)) {

                clearLoop();

                return;

            }

            // 判断是否更新数据

            if (

                dataIndex === 0 &&

                !first &&

                typeof options.updateData === 'function'

            ) {

                options.updateData();

                chart.setOption(chartOption);

            }

            let series = chartOption.series;

            let currSeries = series[seriesIndex];

            if (

                !series ||

                series.length === 0 ||

                !currSeries ||

                !currSeries.type ||

                !currSeries.data ||

                !currSeries.data.length

            ) {

                return;

            }

            chartType = currSeries.type; // 系列类型

            dataLen = currSeries.data.length; // 某个系列的数据个数

            let tipParams = {

                seriesIndex: seriesIndex,

            };

            switch (chartType) {

                case 'pie':

                    // 处理饼图中数据为0或系列名为空的不显示tooltip

                    if (

                        !currSeries.data[dataIndex].name ||

                        currSeries.data[dataIndex].name === '空' ||

                        !currSeries.data[dataIndex].value

                    ) {

                        invalidData += 1;

                        dataIndex = (dataIndex + 1) % dataLen;

                        if (options.loopSeries && dataIndex === 0) {

                            // 数据索引归0表示当前系列数据已经循环完

                            // 无效数据个数个总数据个数相等,则该系列无效

                            if (invalidData === dataLen) {

                                invalidSeries += 1;

                            }

                            // 新系列,重置无效数据个数

                            invalidData = 0;

                            // 系列循环递增1

                            seriesIndex = (seriesIndex + 1) % seriesLen;

                            // 系列数循环至起始值时重置无效系列数

                            if (seriesIndex === options.seriesIndex) {

                                if (seriesLen !== invalidSeries) {

                                    // 下一次系列轮回,重置无效系列数

                                    invalidSeries = 0;

                                    showTip();

                                } else {

                                    // 下一次系列轮回,重置无效系列数

                                    invalidSeries = 0;

                                    clearLoop();

                                }

                            } else {

                                showTip();

                            }

                        } else if (!options.loopSeries && dataIndex === 0) {

                            if (dataLen !== invalidData) {

                                invalidData = 0;

                                showTip();

                            } else {

                                invalidData = 0;

                                clearLoop();

                            }

                        } else {

                            showTip();

                        }

                        return;

                    }

                // eslint-disable-next-line no-fallthrough

                case 'map':

                case 'chord':

                    tipParams.name = currSeries.data[dataIndex].name;

                    break;

                case 'radar': // 雷达图

                    tipParams.seriesIndex = seriesIndex;

                    // tipParams.dataIndex = dataIndex;

                    break;

                case 'lines': // 线图地图上的lines忽略

                    dataIndex = 0;

                    seriesIndex = (seriesIndex + 1) % seriesLen;

                    invalidSeries++; // 记录无效系列数,如果无效系列数和系列总数相等则取消循环显示

                    if (seriesLen !== invalidSeries) {

                        showTip();

                    } else {

                        clearLoop();

                    }

                    return;

                default:

                    tipParams.dataIndex = dataIndex;

                    break;

            }

            if (chartType === 'pie' || chartType === 'radar' || chartType === 'map') {

                if (!first) {

                    cancelHighlight();

                }

                // 高亮当前图形

                chart.dispatchAction({

                    type: 'highlight',

                    seriesIndex: seriesIndex,

                    dataIndex: dataIndex,

                });

            }

            // 显示 tooltip

            tipParams.type = 'showTip';

            chart.dispatchAction(tipParams);

            lastShowSeriesIndex = seriesIndex;

            lastShowDataIndex = dataIndex;

            dataIndex = (dataIndex + 1) % dataLen;

            if(callback){
               callback(chart.getOption().xAxis[lastShowSeriesIndex].data[lastShowDataIndex],true)
            }
            if (options.loopSeries && dataIndex === 0) {

                // 数据索引归0表示当前系列数据已经循环完

                invalidData = 0;

                seriesIndex = (seriesIndex + 1) % seriesLen;

                if (seriesIndex === options.seriesIndex) {

                    invalidSeries = 0;

                }

            }

            first = false;

        }

        showTip();

        timeTicket = setInterval(showTip, options.interval);

    }

    // 关闭轮播

    function stopAutoShow() {

        if (timeTicket) {

            clearInterval(timeTicket);

            timeTicket = 0;

            if (chartType === 'pie' || chartType === 'radar' || chartType === 'map') {

                cancelHighlight();

            }

        }
        if(callback){
           callback(chart.getOption().xAxis[lastShowSeriesIndex].data[lastShowDataIndex],false)
        }
    }

    let zRender = chart.getZr();

    function zRenderMouseMove(param) {

        if (param.event) {

            // 阻止canvas上的鼠标移动事件冒泡

            // param.event.cancelBubble = true;

        }

        stopAutoShow();

    }

    // 离开echarts图时恢复自动轮播

    function zRenderGlobalOut() {

        // console.log("移出了")

        // console.log(timeTicket)

        if (!timeTicket) {

            autoShowTip();

        }

    }

    // 鼠标在echarts图上时停止轮播

    chart.on('mousemove', stopAutoShow);

    zRender.on('mousemove', zRenderMouseMove);

    zRender.on('globalout', zRenderGlobalOut);

    autoShowTip();

    return {
        clearLoop: clearLoop,
        stopAutoShow: stopAutoShow,
        autoShowTip: autoShowTip
    };

}
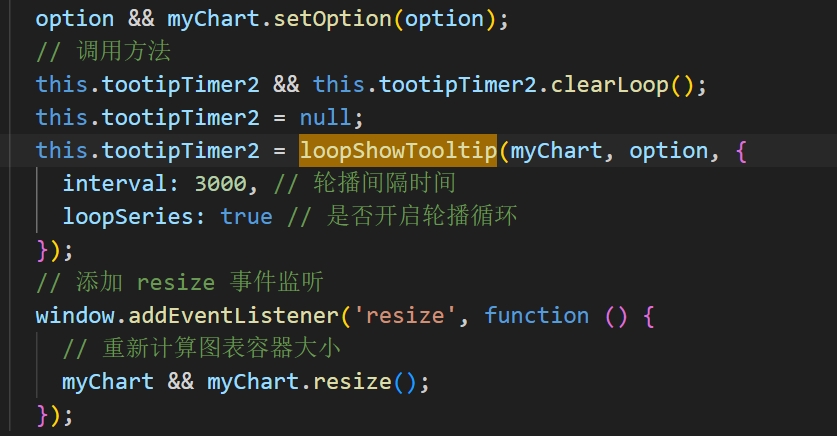
页面使用
import * as echarts from 'echarts';
 // 引入插件
 import { loopShowTooltip } from '@/utils/tooltip-auto-show-vue';

 浙公网安备 33010602011771号