![]()
<template>
  <div class="eWrap" :style="{ height: divHeight }" ref="element">
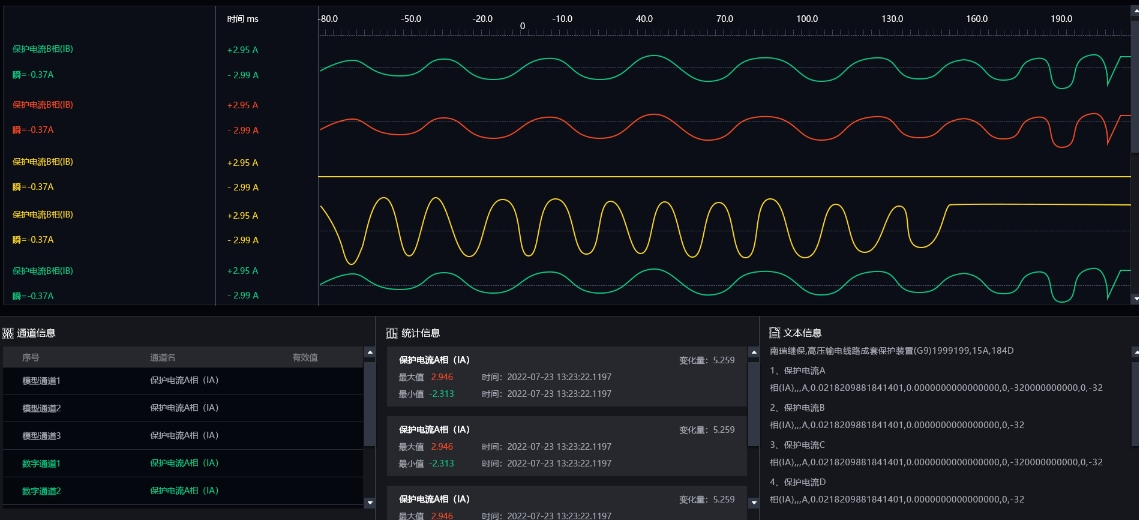
    <div id="echartsDom"></div>
  </div>
</template>

  <script>
import * as echarts from 'echarts';
export default {
  props: ['seriesData', 'receive'],
  data() {
    return {
      chart: null,
      divHeight: 0
    };
  },
  created() {
    console.log('jinyemian');
    this.changeH();
    // let divHeight = 60 * this.seriesData.yData.length + 'px';
    // let length17 = this.seriesData.yData.slice(1, 18).length;
    // let divHeight = 60 * 17 + 'px';
    // this.divHeight = divHeight;
    // let lengthlll = this.seriesData.yData.length;
    // let gridHieght = lengthlll * 0.053;
    // console.log(gridHieght, 'gridHieght');
    // let divHeight = gridHieght * lengthlll + 'px';
  },
  mounted() {
    let height = this.$refs.element.offsetHeight;
    console.log(height, 'heightM');
    // 初始化图表
    this.initChart();
  },
  watch: {
    seriesData(val) {
      console.log(val, 'bh');
      this.updateChart();
    }
    // seriesData: {
    //   handler(val) {
    //     console.log(val, 'bianhua ');
    //     this.updateChart();
    //   }
    // }
  },

  computed: {
    getOption() {
      const that = this;
      let heiLen = that.seriesData.yData.length;
      let grid = [
        {
          left: '5%',
          right: '3%',
          top: (17 / heiLen) * 3 + '%',
          height: (17 / heiLen) * 6 + '%'
          // top: '3%',
          // height: '6%'
        }
      ];
      let xAxis = [
        {
          gridIndex: 0,
          type: 'category',
          position: 'top',
          // 刻度线改为上面
          axisLine: {
            onZero: false,
            lineStyle: {
              color: '#fff',
              width: 1,
              type: 'dotted'
            }
          },
          axisLabel: {
            fontSize: 10
          },
          show: true,
          data: that.seriesData.xData
        }
      ];
      let yAxis = [
        {
          type: 'value',
          axisLine: {
            //y轴线的颜色以及宽度
            show: false,
            // show: true,
            lineStyle: {
              color: '#EFEF00',
              width: 2,
              type: 'solid'
            }
          }
        }
      ];
      let series = [
        {
          type: 'line',
          id: 0,
          name: 0,
          xAxisIndex: 0,
          yAxisIndex: 0,
          data: [],
          markLine: {
            symbol: 'none',
            silent: true,
            label: {
              normal: {
                show: false
              }
            },
            data: []
          },
          symbol: 'none',
          smooth: true //默认是false,判断折线连线是平滑的还是折线
        }
      ];
      // let yData17 = that.seriesData.yData;
      // let yData = yData17.slice(1, 18);
      let yData = that.seriesData.yData;
      // console.log(yData, 'yData');
      let channelList = that.seriesData.channelList;
      console.log(channelList, 'channelList');
      let xAxisIndexs = [0];
      for (var index = 1; index <= yData.length; index++) {
        xAxisIndexs.push(index);
        // console.log(index, '222555');
        let g = {
          left: '5%',
          right: '3%',
          // top: 3 + 4 * (index - 1) + '%',
          // height: '5.3%'
          top: (17 / heiLen) * (3 + 5.3 * (index - 1)) + '%',
          height: (17 / heiLen) * 5.3 + '%'
          // height: index < 17 ? '1%' : '5.3%'
        };
        grid.push(g);
        let x = {
          gridIndex: index,
          type: 'category',
          position: 'top',
          // 刻度线改为上面
          axisLine: {
            onZero: false,
            lineStyle: {
              color: '#fff',
              width: 1,
              type: 'solid'
            }
          },
          axisLabel: {
            fontSize: 10
          },
          show: index === 0,
          data: that.seriesData.xData
        };
        xAxis.push(x);
        let channel = channelList[index - 1];
        // let max = channel.units && channel.map.max > 0 ? channel.map.max : 1;
        // let min = channel.units && channel.map.min < 0 ? channel.map.min : -1;
        // if (max == 0 || min == 0) {
        //   max = 1;
        //   min = -1;
        // }
        let max = channel.units && channel.map.max;
        let min = channel.units && channel.map.min;
        console.log(max, min, 'maxmin');
        if (max == 0 || min == 0) {
          console.log('di1');
          max = 1;
          min = -1;
        } else if (max > 0 || min < 0) {
          console.log('di3');
          max = max;
          min = min;
        } else {
          console.log('di4');
          max = 1;
          min = -1;
        }
        // console.log(max, min, '大小');
        let y = {
          type: 'value',
          gridIndex: index,
          nameTextStyle: {
            fontSize: 12,
            fontWeight: '500'
          },
          max: max * 1,
          min: min * 1,
          axisLine: {
            //y轴线的颜色以及宽度
            show: true,
            lineStyle: {
              color: '#F9D429',
              width: 2,
              type: 'solid'
            }
          },
          axisLabel: {
            show: false
          },
          // 刻度线
          splitLine: {
            show: false
          },
          axisTick: {
            show: false //隐藏y轴刻度
          }
        };
        yAxis.push(y);
        let s = {
          type: 'line',
          id: index,
          name: index,
          xAxisIndex: index,
          yAxisIndex: index,
          data: yData[index - 1],
          lineStyle: {
            color: that.setLineColor(index)
          },
          markLine: {
            symbol: 'none',
            silent: true,
            label: {
              normal: {
                show: false
              }
            },
            data: [
              {
                yAxis: 0,
                lineStyle: {
                  normal: {
                    type: 'dashed',
                    color: '#fff',
                    width: 1
                  }
                }
              }
            ]
          },
          symbol: 'none',
          smooth: true //默认是false,判断折线连线是平滑的还是折线
        };
        series.push(s);
      }
      let option = {
        // backgroundColor: 'rgba(34, 34, 34, 1)',
        grid: grid,
        animation: false,
        // 将上下两个tootip合成一个
        // axisPointer: {
        //   link: { xAxisIndex: 'all' }
        // },
        // dataZoom: [
        //   {
        //     type: 'inside',
        //     xAxisIndex: xAxisIndexs,
        //     filterMode: 'none'
        //   }
        // ],
        xAxis: xAxis,
        yAxis: yAxis,
        series: series
      };
      return option;
    }
  },

  methods: {
    changeH() {
      let divHeight = 60 * this.seriesData.yData.length + 'px';
      this.divHeight = divHeight;
    },
    // 初始化图表方法,初始化只调用一次,不需要重复计算
    initChart() {
      this.chart = echarts.init(document.getElementById('echartsDom'));
      // this.chart.resize({ height: this.seriesData.yData.length * 10 });
      //鼠标点击事件
      this.chart.getZr().on('click', (params) => {
        let index = this.chart.convertFromPixel({ seriesIndex: 0 }, [
          params.offsetX,
          params.offsetY
        ])[0];
        if (index < 0) {
          return;
        }
        let data = {
          xAxis: index,
          lineStyle: {
            normal: {
              type: 'solid',
              color: 'red',
              width: 2
            }
          }
        };
        let option = this.getOption;
        option.series.forEach((s) => {
          if (s.id === 0) {
            s.markLine.data = [data];
          } else {
            s.markLine.data = [
              data,
              {
                yAxis: 0,
                lineStyle: {
                  normal: {
                    type: 'dashed',
                    color: '#fff',
                    width: 1
                  }
                }
              }
            ];
          }
        });
        this.chart.setOption(option);
        // 调用传入的函数,将name传递给父组件
        this.receive(index);
      });
      this.chart.setOption(this.getOption);
      // this.changeH();
    },
    updateChart() {
      // 绘制折线图
      this.$nextTick(() => {
        this.chart.setOption(this.getOption);
      });
    },
    setLineColor(index) {
      let num = index % 4;
      if (num === 2) {
        return '#0CC682';
        // return '#00CF00';
      } else if (num === 3) {
        return '#CF0000';
      } else {
        return '#F9D429';
      }
    }
  }
};
</script>
<style scoped>
.eWrap {
  width: 100%;
  overflow-y: auto;
}
.eWrap #echartsDom {
  width: 100%;
  height: 100%;
}
</style>


 浙公网安备 33010602011771号