Excel处理控件Aspose.Cells教程:使用C#在Exce中创建帕累托线图
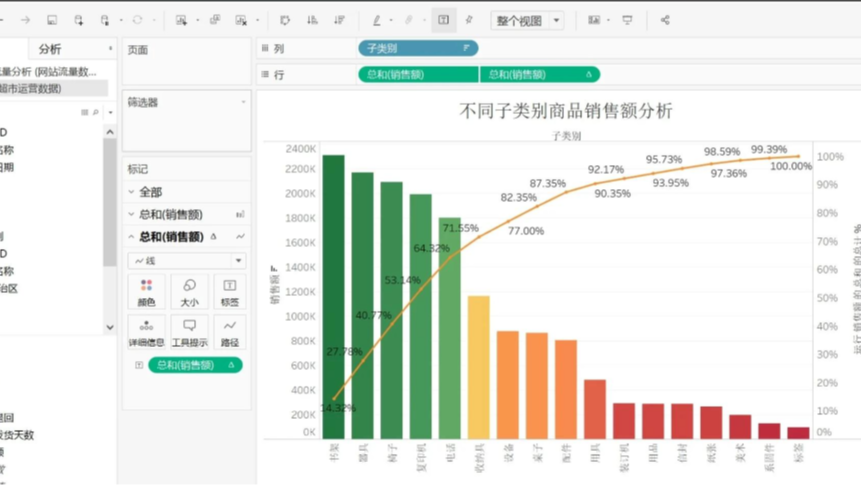 使用帕累托线图可视化缺陷、销售额或任何指标的分布情况,有助于您快速识别最重要的影响因素。本指南将指导您如何使用Aspose.Cells for .NET和 C# 在 Excel 中创建帕累托线图。示例涵盖数据准备、图表创建、帕累托线配置以及将工作簿保存为各种格式。

使用帕累托线图可视化缺陷、销售额或任何指标的分布情况,有助于您快速识别最重要的影响因素。本指南将指导您如何使用Aspose.Cells for .NET和 C# 在 Excel 中创建帕累托线图。示例涵盖数据准备、图表创建、帕累托线配置以及将工作簿保存为各种格式。
Aspose.Cells官方试用版免费下载,请联系Aspose官方授权代理商慧都科技
加入Aspose技术交流QQ群(1041253375),与更多小伙伴一起探讨提升开发技能。
用于创建帕累托线图的 C# Excel 库
Aspose.Cells for .NET是一个功能全面的 Excel 操作库,它允许开发人员在无需安装 Microsoft Office 的情况下创建、修改和渲染 Excel 文件。它支持多种图表类型,包括帕累托线图(ParetoLine chart),该图表将柱状图与累计百分比线相结合。
使用 Aspose.Cells for .NET 的主要优势:
- 丰富的 API – 完全访问 Excel 功能,包括高级图表类型。
- 高性能——高效处理大型工作簿和数据集。
- 多种输出格式– 保存为 XLSX、XLS、CSV、PDF、PNG 等格式。
- 不支持 COM 互操作– 可在任何支持 .NET 的平台上运行。
快速入门:
PM> Install-Package Aspose.Cells使用 C# 在 Excel 中创建帕累托线图
概述

帕累托图本质上是由柱状图(显示原始值)和折线图(显示这些值的累计百分比)组成。步骤如下:
- 创建Workbook并获取第一个工作表。
- 在工作表中填充分类数据及其对应的数值。
- 添加柱状图。
- 添加第二个系列(累计百分比),并将其图表类型设置为折线图。
- 启用线条系列的辅助坐标轴。
- 格式化坐标轴、标题和数据标签。
- 保存工作簿。
完整的 C# 代码示例
// 1. Create a new workbook and get the first worksheet.
var workbook = new Workbook();
var sheet = workbook.Worksheets[0];
sheet.Name = "Defects";

// ------------------------------------------------------------
// 2. Populate worksheet with sample data (Category | Defect Count)
// ------------------------------------------------------------
//    A          B
// 1  Defect     Count
// 2  A          120
// 3  B          90
// 4  C          45
// 5  D          30
// 6  E          15
// ------------------------------------------------------------
sheet.Cells["A1"].Value = "Defect";
sheet.Cells["B1"].Value = "Count";

string[] categories = { "A", "B", "C", "D", "E" };
double[] counts = { 120, 90, 45, 30, 15 };

for (int i = 0; i < categories.Length; i++)
{
    sheet.Cells[i + 1, 0].Value = categories[i];
    sheet.Cells[i + 1, 1].Value = counts[i];
}

// 3. Calculate cumulative percentages (required for Pareto line)
double total = 0;
foreach (var c in counts) total += c;

double cumulative = 0;
for (int i = 0; i < counts.Length; i++)
{
    cumulative += counts[i];
    // Store cumulative percentage in column C (as a decimal, e.g., 0.75)
    sheet.Cells[i + 1, 2].Value = cumulative / total;
}
sheet.Cells["C1"].Value = "Cumulative %";

// 4. Add a Column chart (base type)
int chartIndex = sheet.Charts.Add(ChartType.Column, 7, 0, 25, 15);
Chart chart = sheet.Charts[chartIndex];
chart.Title.Text = "ParetoLine Chart ¨C Defect Distribution";

// 5. Add the primary series (Column) ¨C Defect Count
int columnSeriesIdx = chart.NSeries.Add("=Defects!$B$2:$B$6", true);
chart.NSeries[columnSeriesIdx].Name = "Count";
chart.NSeries[columnSeriesIdx].Type = ChartType.Column; // Explicitly set Column

// 6. Add the secondary series (Line) ¨C Cumulative Percentage
int lineSeriesIdx = chart.NSeries.Add("=Defects!$C$2:$C$6", true);
chart.NSeries[lineSeriesIdx].Name = "Cumulative %";
chart.NSeries[lineSeriesIdx].Type = ChartType.Line; // Set to Line chart
chart.NSeries[lineSeriesIdx].PlotOnSecondAxis = true; // Use secondary axis

// 7. Configure the secondary axis to display percentage format
chart.SecondValueAxis.TickLabels.NumberFormat = "0%";
chart.SecondValueAxis.Title.Text = "Cumulative Percentage";

// 8. Optional: Show data labels for better readability
chart.NSeries[columnSeriesIdx].DataLabels.ShowValue = true;
chart.NSeries[lineSeriesIdx].DataLabels.ShowValue = true;
chart.NSeries[lineSeriesIdx].DataLabels.NumberFormat = "0%";

// 9. Set the primary axis title
chart.CategoryAxis.Title.Text = "Defect Type";
chart.ValueAxis.Title.Text = "Count";

// 10. Save the workbook in XLSX format (can also be saved as PDF, PNG, etc.)
string outputPath = "ParetoLineChart_Output.xlsx";
workbook.Save(outputPath);
Console.WriteLine($"ParetoLine chart created successfully. File saved at: {outputPath}");
关键步骤说明
| 步 | 目的 |
|---|---|
| 2 | 插入帕累托图将要表示的原始数据。 |
| 3 | 计算该系列所需的累计百分比。 |
| 4-5 | 创建基本柱形图并添加第一个系列(缺陷计数)。 |
| 6-7 | 添加第二个系列,将其类型设置为“线”,并将其放置在辅助坐标轴上。 |
| 8 | 将辅助坐标轴格式设置为百分比,并添加数据标签以提高清晰度。 |
| 10 | 保存工作簿;Aspose.Cells 还可以通过更改文件扩展名将图表渲染为 PDF、PNG 等格式。 |
结论
使用 Aspose.Cells for .NET 创建帕累托折线图非常简单:准备数据、添加柱状图、叠加用于显示累计百分比的折线图,并微调外观即可。提供的代码可直接编译运行,生成专业美观的帕累托分析图,并可保存为任何受支持的格式。
Aspose.Cells官方试用版免费下载,请联系Aspose官方授权代理商慧都科技
加入Aspose技术交流QQ群(1041253375),与更多小伙伴一起探讨提升开发技能。

 浙公网安备 33010602011771号