

通过php动态传数据到highcharts
1:在平时工作中,在对数据进行展示的时候,是直接通过后台提供的接口来获取json串,用来展示。今天别人问怎么在本地演示一下请求的动态数据。
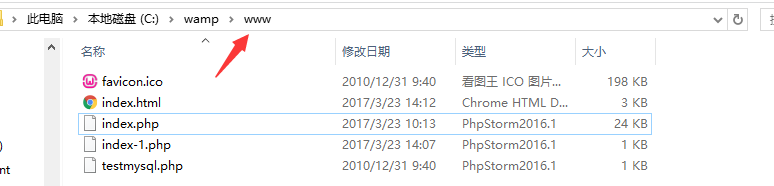
2:在本地搭建环境,我用的WampServer,下载地址:http://221.181.72.84/softdl.360tpcdn.com/WampServer/WampServer_2.5.exe,浏览器打开localhost,文件存放在wamp/www目录下
3:php代码,没有写与数据库实时请求的过程。
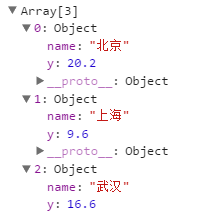
1 <?php
2     $b = array(
3             array('name'=>'北京', 'y'=>20.2),
4             array('name'=>'上海', 'y'=>9.6),
5             array('name'=>'武汉', 'y'=>16.6),
6     );
7     $data = json_encode($b);
8     echo($data);
9 ?>
4:html文件
 1 <!DOCTYPE HTML PUBLIC "-//W3C//DTD HTML 4.01 Transitional//EN" "http://www.w3.org/TR/html4/loose.dtd">
 2 <html>
 3     <head>
 4         <meta charset="utf-8">  <meta name="viewport" content="width=device-width, initial-scale=1">
 5         <meta http-equiv="x-ua-compatible" content="ie=edge">
 6         <link rel="icon" href="https://static.jianshukeji.com/hcode/images/favicon.ico">
 7         <style>
 8         </style>
 9         <script src="https://img.hcharts.cn/jquery/jquery-1.8.3.min.js"></script>
10         <script src="https://img.hcharts.cn/highcharts/highcharts.js"></script>
11         <script src="https://img.hcharts.cn/highcharts/modules/exporting.js"></script>
12         <script src="https://img.hcharts.cn/highcharts-plugins/highcharts-zh_CN.js"></script>
13     </head>
14     <body>
15         <div id="container" style="min-width:400px;height:400px"></div>
16         <script>
17             $(function () {
18                 $.getJSON('http://localhost/index-1.php', function (csv) {
19                     console.log(csv)
20                     $('#container').highcharts({
21                         chart: {
22                             plotBackgroundColor: null,
23                             plotBorderWidth: null,
24                             plotShadow: false
25                         },
26                         title: {
27                             text: ''
28                         },
29                         tooltip: {
30                             pointFormat: '{series.name}: <b>{point.percentage:.1f}%</b>'
31                         },
32                         plotOptions: {
33                             pie: {
34                                 allowPointSelect: true,
35                                 cursor: 'pointer',
36                                 dataLabels: {
37                                     enabled: true,
38                                     color: '#000000',
39                                     connectorColor: '#000000',
40                                     formatter: function() {
41                                         return '<b>'+ this.point.name +'</b>: '+ this.percentage +' %';
42                                     }
43                                 }
44                             }
45                         },
46                         series: [{
47                             type: 'line',
48                             name: '',
49                             data: csv,
50                         }]
51                     });
52                 });
53         });
54         </script>
55     </body>
56 </html>
5:在这里,引入js文件,当需要对一个相同的json串展示为不同的图形时,修改series里的type属性,同时修改highcharts里的数据列参数plotOptions,就可以展示不同的图形了,highcharts可显示图形类型。

php返回数据格式:[{"name":"\u5317\u4eac","y":20.2},{"name":"\u4e0a\u6d77","y":9.6},{"name":"\u6b66\u6c49","y":16.6}],当需要对请求的数据进行处理时,比如只需要其中一部分的数据时,可以在通过get请求数据时,对传过来的数组进行处理:

 浙公网安备 33010602011771号