Matplotlib Date Index Formatter 日期索引格式化学习
官方网站:https://matplotlib.org/gallery/ticks_and_spines/date_index_formatter2.html#sphx-glr-gallery-ticks-and-spines-date-index-formatter2-py
效果图:
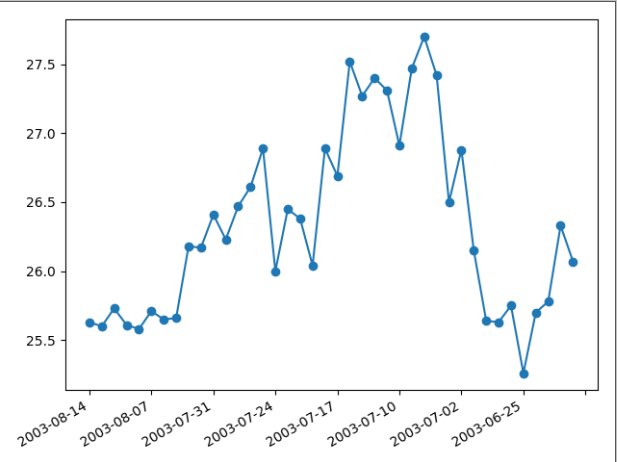
代码:
"""
====================
Date Index Formatter
====================
"""
import numpy as np
import matplotlib.pyplot as plt
import matplotlib.cbook as cbook
from matplotlib.dates import bytespdate2num, num2date
from matplotlib.ticker import Formatter

# 读取matplotlib cbook文件夹下的msft.csv 文件
datafile = cbook.get_sample_data('msft.csv', asfileobj=False)
print('loading %s' % datafile)

# names=True 跳过头行
# 使用最后40行 日期转化为matplotlib Date 格式
msft_data = np.genfromtxt(datafile, delimiter=',', names=True,
                          converters={0: bytespdate2num('%d-%b-%y')})[-40:]
print(msft_data)

class MyFormatter(Formatter):
    def __init__(self, dates, fmt='%Y-%m-%d'):
        self.dates = dates
        self.fmt = fmt

#判断数据这一列的行数并转换显示
    def __call__(self, x, pos=0):
        'Return the label for time x at position pos'
        ind = int(np.round(x))  # round舍去小数点
        if ind >= len(self.dates) or ind < 0:
            return ''

        return num2date(self.dates[ind]).strftime(self.fmt)

# 将Date列的所有数据num转换为%Y-%m-%d 格式的日期
formatter = MyFormatter(msft_data['Date'])
# print (formatter.__dict__)

#设置子图
fig, ax = plt.subplots()
# X轴格式化设置
ax.xaxis.set_major_formatter(formatter)
# X轴对应 Date  Y轴对应 Close   o- 设置曲线样式
ax.plot(np.arange(len(msft_data)), msft_data['Close'], 'o-')
# 旋转对齐X轴日期
fig.autofmt_xdate()
plt.show()

 浙公网安备 33010602011771号