
# -*- coding: utf-8 -*-
"""
Created on Sat Oct 10 15:21:10 2020

分析SMAPE这个指标,特别是对中位数预测的结果评估上

https://www.kaggle.com/cpmpml/smape-weirdness

@author: siriJR
"""

import numpy as np # linear algebra
import pandas as pd # data processing, CSV file I/O (e.g. pd.read_csv)
from matplotlib import pyplot as plt
import seaborn as sns


def smape(y_true, y_pred):
    denominator = (np.abs(y_true) + np.abs(y_pred)) / 200.0
    diff = np.abs(y_true - y_pred) / denominator
    diff[denominator == 0] = 0.0
    return np.nanmean(diff)

#%%

y_true = np.array(3)
y_pred = np.ones(1)
x = np.linspace(0,10,1000)
res = [smape(y_true, i * y_pred) for i in x]
plt.plot(x, res)
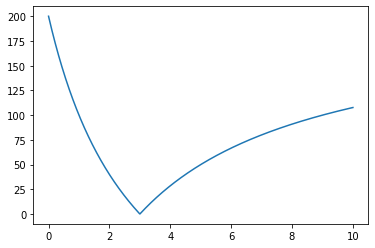
可以看出,低估的惩罚比高估的惩罚要高
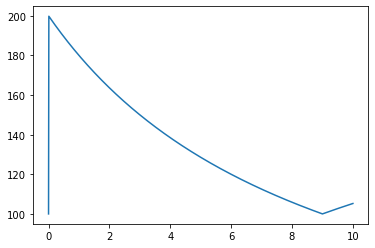
y_true = np.array([1,9])
y_pred = np.ones(len(y_true))
x = np.linspace(0,10,1000)
res = [smape(y_true, i * y_pred) for i in x]
plt.plot(x, res)
print('SMAPE min:%0.2f' % np.min(res), ' at %0.2f' % x[np.argmin(res)])
print('SMAPE is :%0.2f' % smape(y_true, y_pred*np.nanmedian(y_true)),
      ' at median %0.2f' % np.nanmedian(y_true))
SMAPE min:80.00 at 9.00
SMAPE is :95.24 at median 5.00
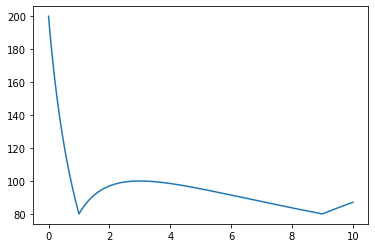
这里,横坐标是y_pred的值,纵坐标是loss,可以看出,y_pred=3时loss最大(100),在y_pred=9时最小(80)。而中值y_pred=5时loss为95.24,明细高于全局最小值点。
#由上可知,smape很难被优化。接下来我们查看更多的点--均匀采样,因为上面的点太少且太离散了

np.random.seed(0)
y_true = np.random.uniform(1, 9, 100)
y_pred = np.ones(len(y_true))
x = np.linspace(0,10,1000)
res = [smape(y_true, i * y_pred) for i in x]
plt.plot(x, res)
print('SMAPE min:%0.2f' % np.min(res), ' at %0.2f' % x[np.argmin(res)])
print('SMAPE is :%0.2f' % smape(y_true, y_pred*np.nanmedian(y_true)),
      ' at median %0.2f' % np.nanmedian(y_true))
SMAPE min:45.32 at 5.23
SMAPE is :45.60 at median 4.74

结果可以看出:最小值点在中值附近~~这也解释了在本次比赛中为什么选手们用中值能取得不错的效果
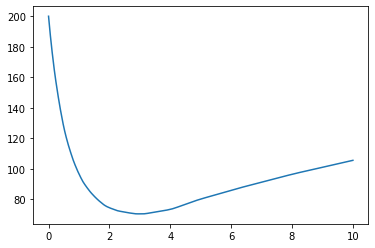
#接下来我们看看偏态分布 skewed distribution

np.random.seed(0)
y_true = np.random.lognormal(1, 1, 100)
y_pred = np.ones(len(y_true))
x = np.linspace(0,10,1000)
res = [smape(y_true, i * y_pred) for i in x]
plt.plot(x, res)
print('SMAPE min:%0.2f' % np.min(res), ' at %0.2f' % x[np.argmin(res)])
print('SMAPE is :%0.2f' % smape(y_true, y_pred*np.nanmedian(y_true)),
      ' at median %0.2f' % np.nanmedian(y_true))
SMAPE min:70.46 at 3.07
SMAPE is :70.49 at median 2.99
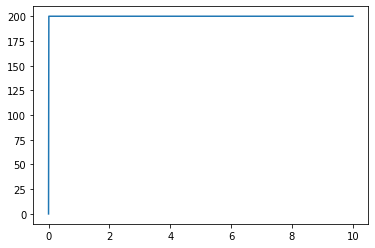
#我们再看看全为0的效果
y_true = np.array([0])
y_pred = np.ones(len(y_true))
x = np.linspace(0,10,1000)
res = [smape(y_true, i * y_pred) for i in x]
plt.plot(x, res)
#再看看两个值

np.random.seed(0)
y_true = np.array([0,9])
y_pred = np.ones(len(y_true))
x = np.linspace(0,10,1000)
res = [smape(y_true, i * y_pred) for i in x]
plt.plot(x, res)
print('SMAPE min:%0.2f' % np.min(res), ' at %0.2f' % x[np.argmin(res)])
print('SMAPE is :%0.2f' % smape(y_true, y_pred*np.nanmedian(y_true)),
      ' at median %0.2f' % np.nanmedian(y_true))
SMAPE min:100.00 at 0.00
SMAPE is :133.33 at median 4.50
参考:https://www.kaggle.com/cpmpml/smape-weirdness

 浙公网安备 33010602011771号