【软件使用】【VSCode】【Debugger for Chrome的使用】
【软件使用】【VSCode】【Debugger for Chrome的使用】
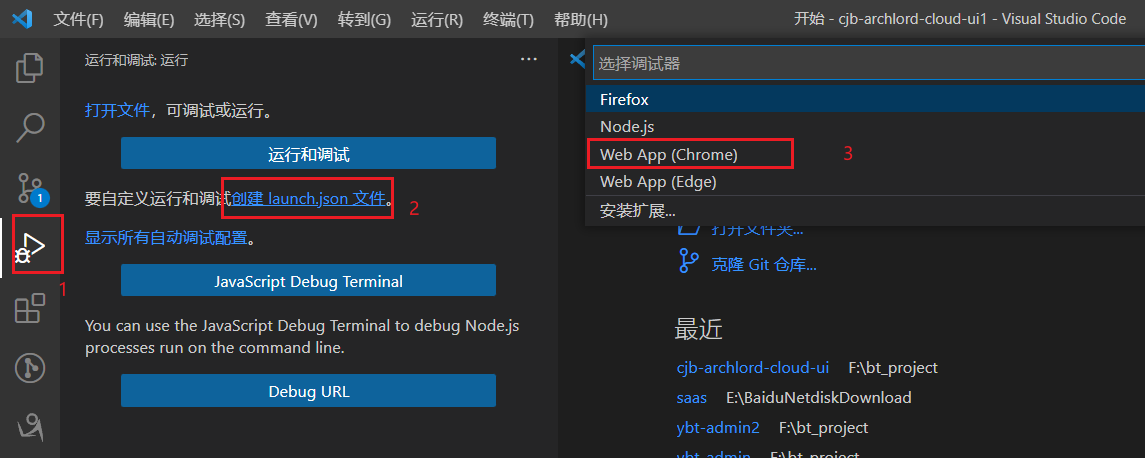
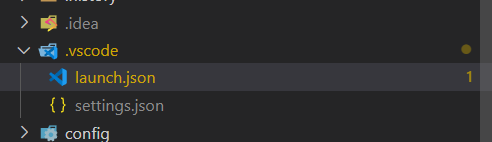
第一步:生成launch.json
第二步:在launch.json添加如下配置
{
  // 使用 IntelliSense 了解相关属性。
  // 悬停以查看现有属性的描述。
  // 欲了解更多信息,请访问: https://go.microsoft.com/fwlink/?linkid=830387
  "version": "0.2.0",
  "configurations": [
    {
      "type": "chrome",
      "request": "launch",
      "name": "vuejs: chrome",
      "url": "http://localhost:8008",
      "webRoot": "${workspaceFolder}/src",
      "breakOnLoad": true,
      "sourceMapPathOverrides": {
        "webpack:///src/*": "${webRoot}/*"
      }
    }
  ]
}
注:url的地址为你的项目启动地址
第三步:在vue.config.js开启source-map
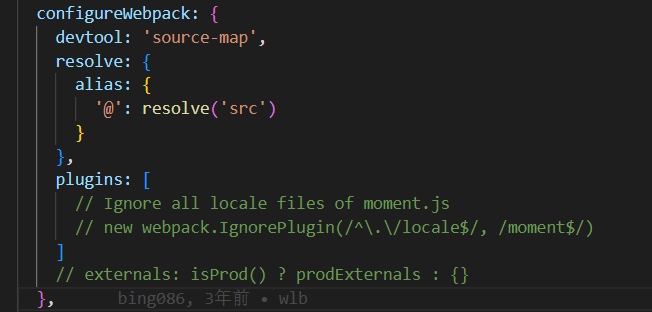
  configureWebpack: {
    devtool: 'source-map',
    resolve: {
      alias: {
        '@': resolve('src')
      }
    }
  },
官方地址:
https://v2.cn.vuejs.org/v2/cookbook/debugging-in-vscode.html
本文来自博客园,作者:时光与简,转载请注明原文链接:https://www.cnblogs.com/simpletime/p/16844008.html

 浙公网安备 33010602011771号