
http://my.oschina.net/costaxu/blog/189406
mongodb新手, 请指正。
0 查看mongodb 版本
db.serverStatus()["version"]
1 查看锁
db.serverStatus()["globalLock"]
|
1
2
3
4
5
6
7
8
9
10
11
12
13
14
|
{ "totalTime" : NumberLong("59472944000"), "lockTime" : NumberLong(296702397), "currentQueue" : { "total" : 9, "readers" : 9, "writers" : 0 }, "activeClients" : { "total" : 1, "readers" : 0, "writers" : 1 }} |
totalTime是数据库启动之后的总时间, 单位是micro second
lockTime为处于锁定状态的时间。 如果锁定状态的时间占总时间较大的比例的话,说明很多请求实际上是在等待锁的释放。
current queue表示等待锁的请求数量。 reader表示在等待读锁的请求数量。 writers表示等待写锁的请求数量。
active clients表示处于连接状态的client的数量。
db.serverStatus()["locks"] 这个命令可以从一个更细的粒度查看锁的情况。
|
1
2
3
4
5
6
7
8
9
10
11
12
13
14
15
16
17
18
19
20
21
22
23
24
25
26
27
28
29
30
31
32
33
34
35
36
37
38
39
40
41
42
|
{ "." : { "timeLockedMicros" : { "R" : NumberLong(27575643), "W" : NumberLong(300769879) }, "timeAcquiringMicros" : { "R" : NumberLong("7300086599"), "W" : NumberLong(921784415) } }, "admin" : { "timeLockedMicros" : { "r" : NumberLong(4879), "w" : NumberLong(0) }, "timeAcquiringMicros" : { "r" : NumberLong(123), "w" : NumberLong(0) } }, "local" : { "timeLockedMicros" : { "r" : NumberLong(104231010), "w" : NumberLong(171946358) }, "timeAcquiringMicros" : { "r" : NumberLong(740624790), "w" : NumberLong(292131659) } }, "user" : { "timeLockedMicros" : { "r" : NumberLong("34795096720"), "w" : NumberLong("12286042695") }, "timeAcquiringMicros" : { "r" : NumberLong("67754724106"), "w" : NumberLong("10418999128") } }} |
"."这一节代表全局锁的锁定时间和等待时间。其他的是各个db的锁定时间。锁定时间长,代表长时间查询过多。
2 查看collection的状态
命令: db.collection.stats()
|
1
2
3
4
5
6
7
8
9
10
11
12
13
14
15
16
17
18
19
20
21
|
db.channels.stats(){ "ns" : "user.channels", "count" : 53409370, "size" : 14972217152, "avgObjSize" : 280.3294094650433, "storageSize" : 20933169056, "numExtents" : 30, "nindexes" : 3, "lastExtentSize" : 2146426864, "paddingFactor" : 1.0060000002673208, "systemFlags" : 1, "userFlags" : 0, "totalIndexSize" : 6916577136, "indexSizes" : { "_id_" : 2258914336, "usrID_1" : 2033027808, "num_1" : 2624634992 }, "ok" : 1} |
count是记录数量, size是总共的字节数。 avgObjSize是平均的 字节数。
3 mongostat命令
mongostat
|
1
2
3
4
5
6
7
8
|
insert query update delete getmore command flushes mapped vsize res faults locked db idx miss % qr|qw ar|aw netIn netOut conn repl time 2 108 4 *0 8 5|0 0 42g 84.4g 1.82g 61 user:0.4% 0 0|0 0|0 14k 58m 14 PRI 16:31:28 56 74 5 1 25 7|0 0 42g 84.4g 1.82g 29 user:15.2% 0 0|0 0|0 25k 34m 14 PRI 16:31:29 217 84 5 1 43 7|0 0 42g 84.4g 1.83g 76 user:10.5% 0 0|0 0|0 64k 56m 14 PRI 16:31:30 1 73 3 *0 4 4|0 0 42g 84.4g 1.81g 18 user:6.2% 0 0|0 0|0 9k 41m 14 PRI 16:31:31 *0 56 5 *0 12 4|0 0 42g 84.4g 1.8g 17 user:0.6% 0 0|0 0|0 8k 43m 14 PRI 16:31:32 2 78 5 1 45 7|0 0 42g 84.4g 1.8g 16 user:6.6% 0 0|0 0|0 17k 16m 14 PRI 16:31:33 *0 84 4 1 6 6|0 0 42g 84.4g 1.78g 67 user:8.4% 0 0|0 4|0 10k 8m 14 PRI 16:31:34 |
类似vmstat, 每秒钟会打印一行数据。
insert query update delete分别代表一秒钟之内执行的操作次数。
res是mongod所占用的物理内存, faluts表示page faults的次数。
locked db是一个字段。 2.2之前是用locked字段。 2.2之后才有这个字段。 这个字段的含义, 不是太明白。 只能明确1点, 即展示的是所有db里面锁定时间 最长的db 。 可以参详一下官网原文:
|
1
2
3
|
The percent of time in the per-database context-specific lock. mongostat will report the database that has spent the most time since the last mongostat call with a write lock.This value represents the amount of time that the listed database spent in a locked state combined with the time that the mongod spent in the global lock. Because of this, and the sampling method, you may see some values greater than 100%. |
index miss是索引缺失的数量
qr|qw 表示在队列中等待的客户端。 rw表示读和写。
ar|aw 表示正在进行请求的客户端。 rw表示读和写。 至于为什么为0我也不是很明白。
netIn 和 netOut表示网络流量,单位是字节 byte.
conn表示连接数,这个没有什么好说。
repl表示同步状态。官网给出文档是这样:
|
1
2
3
4
5
|
M masterSEC secondaryREC recoveringUNK unknownSLV slave |
在我mongo 2.4.8的机器上,
PRI表示主机。SLV表示从机。
4 profiling
profiling是设置一个全server级别的慢日志,将慢查询保存下来。 慢查询的数据会保存到 system.profile中。
打开profiling:
|
1
2
|
>db.setProfilingLevel(1,1000){ "was" : 0, "slowms" : 20, "ok" : 1 } |
第一个参数表示Profile的级别, 第二个参数是定义慢查询的阈值。
profile级别0不保存, 1只保存慢查询,2保存所有查询。
注意级别是对应当前的数据库, 而阈值是全局的。
查看profiling状态:
|
1
2
|
>db.getProfilingStatus(){ "was" : 1, "slowms" : 1000 } |
关闭profiling:
|
1
|
>db.setProfilingLevel(0, 1000) |
查看慢查询, 其实就是在system.profile里查:
|
1
2
3
4
5
6
7
8
9
10
11
12
13
14
15
16
17
18
19
20
21
22
23
24
25
26
27
28
29
30
31
32
33
34
35
36
37
|
db.system.profile.find({"op":"query"}).sort({"ts":-1}).limit(1).pretty(){ "op" : "query", "ns" : "user.channels", "query" : { "$query" : { "usrID" : "364076", "status" : 1 }, "orderby" : { "num" : 1 } }, "ntoreturn" : 0, "ntoskip" : 0, "nscanned" : 544, "scanAndOrder" : true, "keyUpdates" : 0, "numYield" : 20, "lockStats" : { "timeLockedMicros" : { "r" : NumberLong(1328924), "w" : NumberLong(0) }, "timeAcquiringMicros" : { "r" : NumberLong(1775760), "w" : NumberLong(54728) } }, "nreturned" : 544, "responseLength" : 92082, "millis" : 1777, "ts" : ISODate("2014-01-01T11:45:02.156Z"), "client" : "127.0.0.1", "allUsers" : [ ], "user" : ""} |
具体的字段含义我只能猜一下, nscanned是扫描的记录数, 锁状态里面的应该是锁定和获取锁的时间。可以看到这个查询几乎所有的时间都用在等待一把读锁的释放。 millis是执行的时间。
最后注意, system.profile是固定大小的collection, 默认大小是1M。 如果要修改该大小, 用下面的方法:
|
1
2
3
4
5
6
7
|
db.setProfilingLevel(0)db.system.profile.drop()db.createCollection( "system.profile", { capped: true, size:4000000 } )db.setProfilingLevel(1) |
5 mongotop
mongotop可以显示collection级别的运行时间:
|
1
2
3
4
5
6
7
|
ns total read write 2014-01-01T11:54:14 admin.system.indexes 0ms 0ms 0ms admin.system.users 0ms 0ms 0ms local.oplog.$main 0ms 0ms 0ms local.slaves 0ms 0ms 0ms local.startup_log 0ms 0ms 0ms local.system.indexes 0ms 0ms 0ms |
total = read+write
mongotop和vmstat的参数一样,可以指定间隔时间。
6 web监控界面
一般是mongod服务器的28017端口。
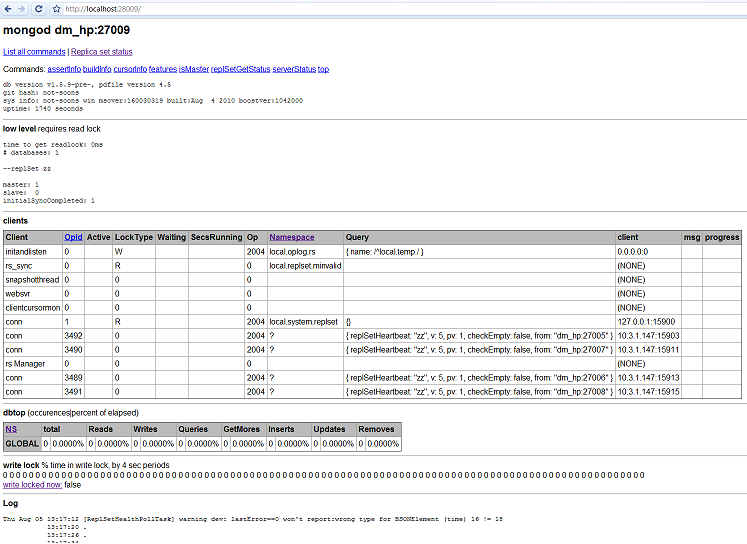
第一部份是服务基本信息。
第二部份是当前的client的监控。 可以看到锁的类型, 和是否等待和查询信息。
第三部份是dbtop, 和mongotop结果类似。
第四部份是log。

 浙公网安备 33010602011771号