
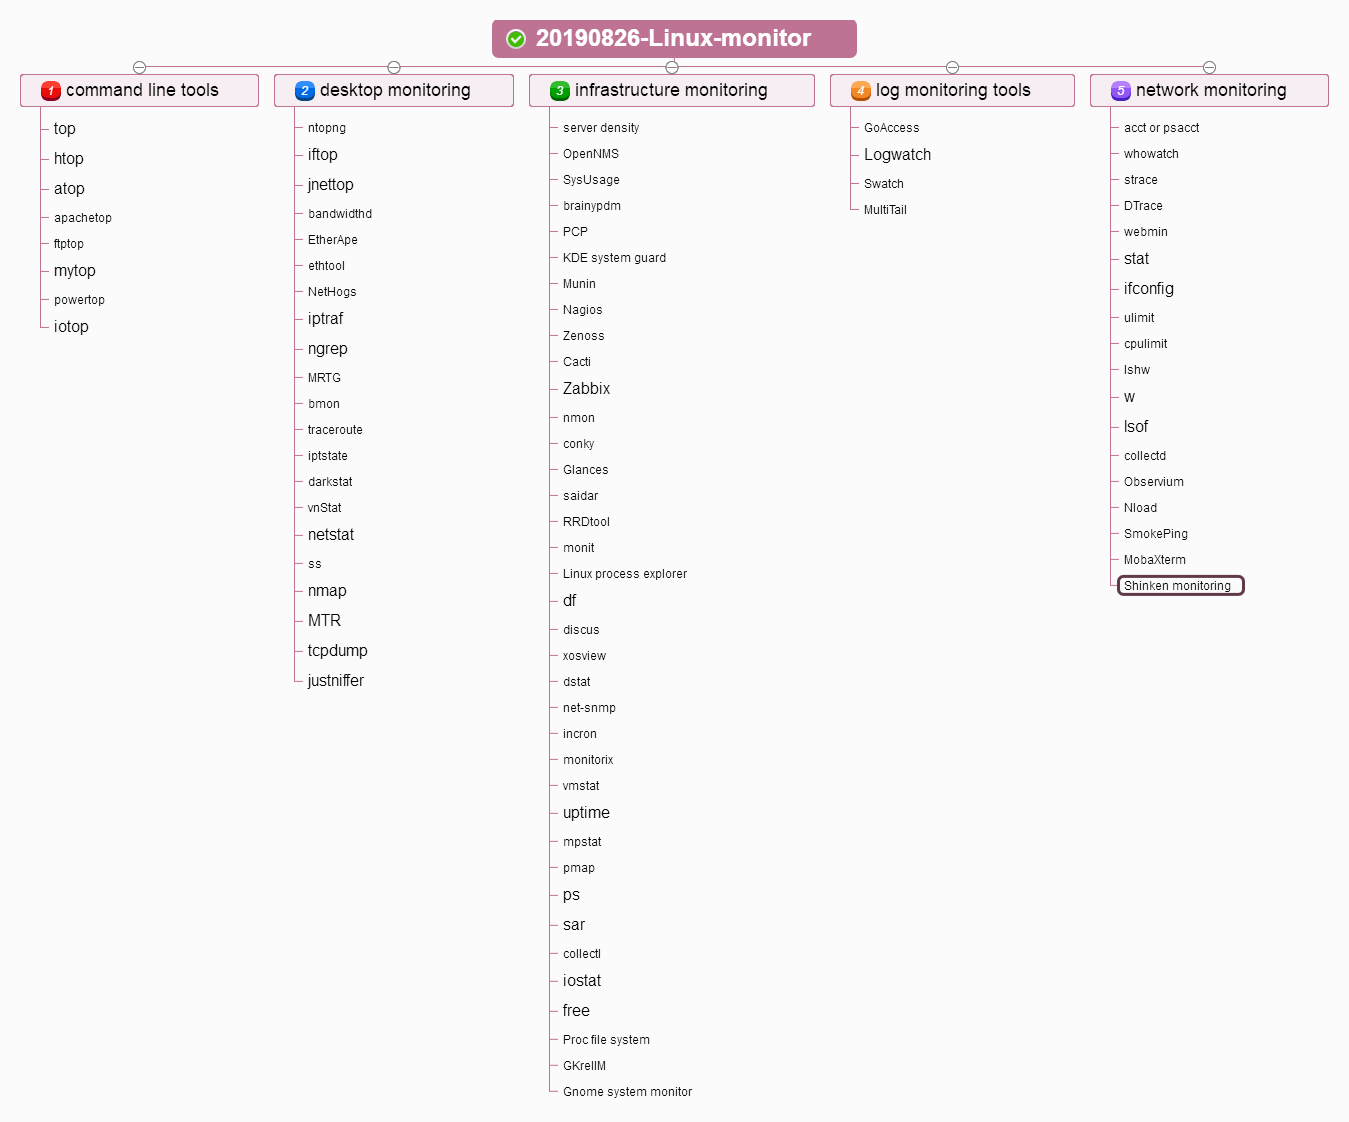
Linux-Monitor-Tools
80+ Linux Monitoring Tools for SysAdmins
command line tools
1、top :系统自带
This is a small tool which is pre-installed on many unix systems. When you want an overview of all the processes or threads running in the system: top is a good tool. Order processes on different criteria – the default of which is CPU.
2、htop:
Htop is essentially an enhanced version of top. It’s easier to sort by processes. It’s visually easier to understand and has built in commands for common things you would like to do. Plus it’s fully interactive.
安装htop
yum install -y ncurses-devel
mkdir -p /usr/local/htop
cd /usr/local/htop
wget http://ftp.gnu.org/pub/gnu/ncurses/ncurses-5.9.tar.gz
wget http://sourceforge.net/projects/htop/files/htop/1.0.2/htop-1.0.2.tar.gz
tar zxvf ncurses-5.9.tar.gz
tar zxvf htop-1.0.2.tar.gz
cd ncurses-5.9 && ./configure && make && make install
cd .. && cd htop-1.0.2 && ./configure && make && make install
cp htop /usr/local/sbin
3、atop:
Atop monitors all processes much like top and htop, unlike top and htop however it has daily logging of the processes for long-term analysis. It also shows resource consumption by all processes. It will also highlight resources that have reached a critical load.
安装atop:使用EPEL源
cd  /tmp
wget -c http://dl.fedoraproject.org/pub/epel/epel-release-latest-7.noarch.rpm
sudo yum install epel-release-latest-7.noarch.rpm
yum install -y atop
4、apachetop:
Apachetop monitors the overall performance of your apache webserver. It’s largely based on mytop. It displays current number of reads, writes and the overall number of requests processed.
5、ftptop:
ftptop gives you basic information of all the current ftp connections to your server such as the total amount of sessions, how many are uploading and downloading and who the client is.
6、mytop:安装及使用
mytop is a neat tool for monitoring threads and performance of mysql. It gives you a live look into the database and what queries it’s processing in real time.
vim ~/.mytop      #编辑配置文件,内容如下
user=mysql用户
pass=mysql密码
host=localhost
db=要监控的数据库名
delay=5
port=3306
socket=/var/lib/mysql/mysql.sock
batchmode=0
header=1
color=1
idle=1
7、powertop 可yum:
powertop helps you diagnose issues that has to do with power consumption and power management. It can also help you experiment with power management settings to achieve the most efficient settings for your server. You switch tabs with the tab key.
8、iotop 可yum:
iotop checks the I/O usage information and gives you a top-like interface to that. It displays columns on read and write and each row represents a process. It also displays the percentage of time the process spent while swapping in and while waiting on I/O.
desktop monitoring
9、ntopng:
ntopng is the next generation of ntop and the tool provides a graphical user interface via the browser for network monitoring. It can do stuff such as: geolocate hosts, get network traffic and show ip traffic distribution and analyze it.
10、iftop:
iftop is similar to top, but instead of mainly checking for cpu usage it listens to network traffic on selected network interfaces and displays a table of current usage. It can be handy for answering questions such as “Why on earth is my internet connection so slow?!”.
11、 jnettop :
jnettop visualises network traffic in much the same way as iftop does. It also supports customizable text output and a machine-friendly mode to support further analysis.
12、bandwidthd :
BandwidthD tracks usage of TCP/IP network subnets and visualises that in the browser by building a html page with graphs in png. There is a database driven system that supports searching, filtering, multiple sensors and custom reports.
13、EtherApe :
EtherApe displays network traffic graphically, the more talkative the bigger the node. It either captures live traffic or can read it from a tcpdump. The displayed can also be refined using a network filter with pcap syntax.
14、ethtool :
ethtool is used for displaying and modifying some parameters of the network interface controllers. It can also be used to diagnose Ethernet devices and get more statistics from the devices.
15、NetHogs:
NetHogs breaks down network traffic per protocol or per subnet. It then groups by process. So if there’s a surge in network traffic you can fire up NetHogs and see which process is causing it.
16、iptraf 可yum:
iptraf gathers a variety of metrics such as TCP connection packet and byte count, interface statistics and activity indicators, TCP/UDP traffic breakdowns and station packet and byte counts.
17、ngrep: 使用介绍
ngrep is grep but for the network layer. It’s pcap aware and will allow to specify extended regular or hexadecimal expressions to match against packets of .
ngrep host 192.168.1.8 udp                                               #抓udp包
ngrep -W byline -qd any '.event' udp port 1514                                   #抓取1514端口udp包,过滤正则匹配包含‘event’字段的包
ngrep -W byline 'GET /' 'tcp and dst port 80' -d eth1 | awk -v RS="#+" -v FS="\n" 'length() > 1000'    #查询大于1k的请求头
ngrep -d en0 -W byline host 61.135.169.125                                      #抓取本地 en0 和 61.135.169.125(百度ip)的通信信息,并以行打印出来
18、MRTG:
MRTG was orginally developed to monitor router traffic, but now it’s able to monitor other network related things as well. It typically collects every five minutes and then generates a html page. It also has the capability of sending warning emails.
19、bmon:
Bmon monitors and helps you debug networks. It captures network related statistics and presents it in human friendly way. You can also interact with bmon through curses or through scripting.
20、traceroute 自带:
Traceroute is a built-in tool for displaying the route and measuring the delay of packets across a network.
21、iptstate 可yum:
IPTState allows you to watch where traffic that crosses your iptables is going and then sort that by different criteria as you please. The tool also allows you to delete states from the table.
22、darkstat:
Darkstat captures network traffic and calculates statistics about usage. The reports are served over a simple HTTP server and gives you a nice graphical user interface of the graphs.
23、vnStat:
vnStat is a network traffic monitor that uses statistics provided by the kernel which ensures light use of system resources. The gathered statistics persists through system reboots. It has color options for the artistic sysadmins.
24、netstat 自带:
Netstat is a built-in tool that displays TCP network connections, routing tables and a number of network interfaces. It’s used to find problems in the network.
25、ss 自带:
Instead of using netstat, it’s however preferable to use ss. The ss command is capable of showing more information than netstat and is actually faster. If you want a summary statistics you can use the command ss -s.
26、nmap 可yum:
Nmap allows you to scan your server for open ports or detect which OS is being used. But you could also use this for SQL injection vulnerabilities, network discovery and other means related to penetration testing.
27、MTR 可yum:
MTR combines the functionality of traceroute and the ping tool into a single network diagnostic tool. When using the tool it will limit the number hops individual packets has to travel while also listening to their expiry. It then repeats this every second.
28、tcpdump 自带:
tcpdump will output a description of the contents of the packet it just captured which matches the expression that you provided in the command. You can also save the this data for further analysis
29、justniffer:
Justniffer is a tcp packet sniffer. You can choose whether you would like to collect low-level data or high-level data with this sniffer. It also allows you to generate logs in customizable way. You could for instance mimic the access log that apache has.
infrastructure monitoring
30、server density:
Our server monitoring tool! It has a web interface that allows you to set alerts and view graphs for all system and network metrics. You can also set up monitoring of websites whether they are up or down. Server Density allows you to set permissions for users and you can extend your monitoring with our plugin infrastructure or api. The service already supports Nagios plugins.
31、OpenNMS:
OpenNMS has four main functional areas: event management and notifications; discovery and provisioning; service monitoring and data collection. It’s designed to be customizable to work in a variety of network environments.
32、SysUsage:
SysUsage monitors your system continuously via Sar and other system commands. It also allows notifications to alarm you once a threshold is reached. SysUsage itself can be run from a centralized place where all the collected statistics are also being stored. It has a web interface where you can view all the stats.
33、brainypdm:
brainypdm is a data management and monitoring tool that has the capability to gather data from nagios or another generic source to make graphs. It’s cross-platform, has custom graphs and is web based.
34、PCP:
PCP has the capability of collating metrics from multiple hosts and does so efficiently. It also has a plugin framework so you can make it collect specific metrics that is important to you. You can access graph data through either a web interface or a GUI. Good for monitoring large systems.
35、KDE system guard :
This tool is both a system monitor and task manager. You can view server metrics from several machines through the worksheet and if a process needs to be killed or if you need to start a process it can be done within KDE system guard.
36、Munin :
Munin is both a network and a system monitoring tool which offers alerts for when metrics go beyond a given threshold. It uses RRDtool to create the graphs and it has web interface to display these graphs. Its emphasis is on plug and play capabilities with a number of plugins available.
37、Nagios :
Nagios is a system and network monitoring tool that helps you monitor your many servers. It has support for alerting for when things go wrong. It also has many plugins written for the platform.
38、Zenoss :
Zenoss provides a web interface that allows you to monitor all system and network metrics. Moreover it discovers network resources and changes in network configurations. It has alerts for you to take action on and it supports the Nagios plugins.
39、Cacti:
(And one for luck!) Cacti is network graphing solution that uses the RRDtool data storage. It allows a user to poll services at predetermined intervals and graph the result. Cacti can be extended to monitor a source of your choice through shell scripts.
40、Zabbix:
Zabbix is an open source infrastructure monitoring solution. It can use most databases out there to store the monitoring statistics. The Core is written in C and has a frontend in PHP. If you don't like installing an agent, Zabbix might be an option for you.
41、nmon:
nmon either outputs the data on screen or saves it in a comma separated file. You can display CPU, memory, network, filesystems, top processes. The data can also be added to a RRD database for further analysis.
42、conky:
Conky monitors a plethora of different OS stats. It has support for IMAP and POP3 and even support for many popular music players! For the handy person you could extend it with your own scripts or programs using Lua.
43、Glances:
Glances monitors your system and aims to present a maximum amount of information in a minimum amount of space. It has the capability to function in a client/server mode as well as monitoring remotely. It also has a web interface.
44、saidar:
Saidar is a very small tool that gives you basic information about your system resources. It displays a full screen of the standard system resources. The emphasis for saidar is being as simple as possible.
45、RRDtool:
RRDtool is a tool developed to handle round-robin databases or RRD. RRD aims to handle time-series data like CPU load, temperatures etc. This tool provides a way to extract RRD data in a graphical format.
46、monit:
Monit has the capability of sending you alerts as well as restarting services if they run into trouble. It’s possible to perform any type of check you could write a script for with monit and it has a web user interface to ease your eyes.
47、Linux process explorer:
Linux process explorer is akin to the activity monitor for OSX or the windows equivalent. It aims to be more usable than top or ps. You can view each process and see how much memory usage or CPU it uses.
48、df:
df is an abbreviation for disk free and is pre-installed program in all unix systems used to display the amount of available disk space for filesystems which the user have access to.
49、discus:
Discus is similar to df however it aims to improve df by making it prettier using fancy features as colors, graphs and smart formatting of numbers.
50、xosview:
xosview is a classic system monitoring tool and it gives you a simple overview of all the different parts of the including IRQ.
51、dstat 可yum:
Dstat aims to be a replacement for vmstat, iostat, netstat and ifstat. It allows you to view all of your system resources in real-time. The data can then be exported into csv. Most importantly dstat allows for plugins and could thus be extended into areas not yet known to mankind.
52、net-snmp 可yum:
SNMP is the protocol ‘simple network management protocol’ and the Net-SNMP tool suite helps you collect accurate information about your servers using this protocol.
53、incron:
Incron allows you to monitor a directory tree and then take action on those changes. If you wanted to copy files to directory ‘b’ once new files appeared in directory ‘a’ that’s exactly what incron does.
54、monitorix:
Monitorix is lightweight system monitoring tool. It helps you monitor a single machine and gives you a wealth of metrics. It also has a built-in HTTP server to view graphs and a reporting mechanism of all metrics.
55、vmstat:
vmstat or virtual memory statistics is a small built-in tool that monitors and displays a summary about the memory in the machine.
56、uptime:
This small command that quickly gives you information about how long the machine has been running, how many users currently are logged on and the system load average for the past 1, 5 and 15 minutes.
57、mpstat 自带:
mpstat is a built-in tool that monitors cpu usage. The most common command is using
mpstat -P ALLwhich gives you the usage of all the cores. You can also get an interval update of the CPU usage.
58、pmap 自带:
pmap is a built-in tool that reports the memory map of a process. You can use this command to find out causes of memory bottlenecks.
59、ps 自带:
The ps command will give you an overview of all the current processes. You can easily select all processes using the command
ps -A
60、sar 自带:
sar is a part of the sysstat package and helps you to collect, report and save different system metrics. With different commands it will give you CPU, memory and I/O usage among other things.
61、collectl:
Similar to sar collectl collects performance metrics for your machine. By default it shows cpu, network and disk stats but it collects a lot more. The difference to sar is collectl is able to deal with times below 1 second, it can be fed into a plotting tool directly and collectl monitors processes more extensively.
62、iostat 可yum:
iostat is also part of the sysstat package. This command is used for monitoring system input/output. The reports themselves can be used to change system configurations to better balance input/output load between hard drives in your
63、free:
This is a built-in command that displays the total amount of free and used physical memory on your machine. It also displays the buffers used by the kernel at that given moment.
64、Proc file system:
The proc file system gives you a peek into kernel statistics. From these statistics you can get detailed information about the different hardware devices on your machine. Take a look at the full list of the proc file statistics
65、GKrellM:
GKrellm is a gui application that monitor the status of your hardware such CPU, main memory, hard disks, network interfaces and many other things. It can also monitor and launch a mail reader of your choice.
66、Gnome system monitor:
Gnome system monitor is a basic system monitoring tool that has features looking at process dependencies from a tree view, kill or renice processes and graphs of all server metrics.
log monitoring tools
67、GoAccess:
GoAccess is a real-time web log analyzer which analyzes the access log from either apache, nginx or amazon cloudfront. It’s also possible to output the data into HTML, JSON or CSV. It will give you general statistics, top visitors, 404s, geolocation and many other things.
68、Logwatch 可yum:
Logwatch is a log analysis system. It parses through your system’s logs and creates a report analyzing the areas that you specify. It can give you daily reports with short digests of the activities taking place on your machine.
69、Swatch:
Much like Logwatch Swatch also monitors your logs, but instead of giving reports it watches for regular expression and notifies you via mail or the console when there is a match. It could be used for intruder detection for example.
70、MultiTail:
MultiTail helps you monitor logfiles in multiple windows. You can merge two or more of these logfiles into one. It will also use colors to display the logfiles for easier reading with the help of regular expressions.
network monitoring
71、acct or psacct:
acct or psacct (depending on if you use apt-get or yum) allows you to monitor all the commands a users executes inside the system including CPU and memory time. Once installed you get that summary with the command ‘sa’.
72、whowatch:
Similar to acct this tool monitors users on your system and allows you to see in real time what commands and processes they are using. It gives you a tree structure of all the processes and so you can see exactly what’s happening.
73、strace 自带:
strace is used to diagnose, debug and monitor interactions between processes. The most common thing to do is making strace print a list of system calls made by the program which is useful if the program does not behave as expected.
74、DTrace:
DTrace is the big brother of strace. It dynamically patches live running instructions with instrumentation code. This allows you to do in-depth performance analysis and troubleshooting. However, it’s not for the weak of heart as there is a 1200 book written on the topic.
75、webmin:
Webmin is a web-based system administration tool. It removes the need to manually edit unix configuration files and lets you manage the system remotely if need be. It has a couple of monitoring modules that you can attach to it.
76、stat 自带:
Stat is a built-in tool for displaying status information of files and file systems. It will give you information such as when the file was modified, accessed or changed.
77、ifconfig net-tools.x86_64:
ifconfig is a built-in tool used to configure the network interfaces. Behind the scenes network monitor tools use ifconfig to set it into promiscuous mode to capture all packets. You can do it yourself with
ifconfig eth0 promiscand return to normal mode with.ifconfig eth0 -promisc
78、ulimit 自带:
ulimit is a built-in tool that monitors system resources and keeps a limit so any of the monitored resources don’t go overboard. For instance making a fork bomb where a properly configured ulimit is in place would be totally fine.
79、cpulimit:
CPUlimit is a small tool that monitors and then limits the CPU usage of a process. It’s particularly useful to make batch jobs not eat up too many CPU cycles.
80、lshw 自带:
lshw is a small built-in tool extract detailed information about the hardware configuration of the machine. It can output everything from CPU version and speed to mainboard configuration.
81、w 自带:
W is a built-in command that displays information about the users currently using the machine and their processes.
82、lsof 自带:
lsof is a built-in tool that gives you a list of all open files and network connections. From there you can narrow it down to files opened by processes, based on the process name, by a specific user or perhaps kill all processes that belongs to a specific user.
Thanks for your suggestions. It's an oversight on our part that we'll have to go back trough and renumber all the headings. In light of that, here's a short section at the end for some of the Linux monitoring tools recommended by you:
83、 collectd:
Collectd is a Unix daemon that collects all your monitoring statistics. It uses a modular design and plugins to fill in any niche monitoring. This way collectd stays as lightweight and customizable as possible.
84、Observium:
Observium is an auto-discovering network monitoring platform supporting a wide range of hardware platforms and operating systems. Observium focuses on providing a beautiful and powerful yet simple and intuitive interface to the health and status of your network.
85、Nload:
It's a command line tool that monitors network throughput. It's neat because it visualizes the in and and outgoing traffic using two graphs and some additional useful data like total amount of transferred data. You can install it with
yum install nloador
sudo apt-get install nload
86、SmokePing:
SmokePing keeps track of the network latencies of your network and it visualises them too. There are a wide range of latency measurement plugins developed for SmokePing. If a GUI is important to you it's there is an ongoing development to make that happen.
87、MobaXterm:
If you're working in windows environment day in and day out. You may feel limited by the terminal Windows provides. MobaXterm comes to the rescue and allows you to use many of the terminal commands commonly found in Linux. Which will help you tremendously in your monitoring needs!
88、Shinken monitoring:
Shinken is a monitoring framework which is a total rewrite of Nagios in python. It aims to enhance flexibility and managing a large environment. While still keeping all your nagios configuration and plugins.

 浙公网安备 33010602011771号