

环境是:wamp
PHP Version: 5.5.12
网上的教程很多,我自己按照教程操作,实现了断点调试,下面是我设置断点调试的步骤
1.修改配置文件php.ini,按下面修改(位置在最后)
; XDEBUG Extension
zend_extension = "D:/wamp/bin/php/php5.5.12/zend_ext/php_xdebug-2.2.5-5.5-vc11.dll"
;
[xdebug]
xdebug.remote_enable = on
xdebug.remote_host="127.0.0.1"
xdebug.port=9000
xdebug.profiler_enable = on
xdebug.profiler_enable_trigger = off
xdebug.profiler_output_name = cachegrind.out.%t.%p
xdebug.remote_autostart=on
xdebug.profiler_output_dir = "D:/wamp/tmp"
xdebug.show_local_vars=0
xdebug.idekey = PHPSTORM
修改完后重启服务
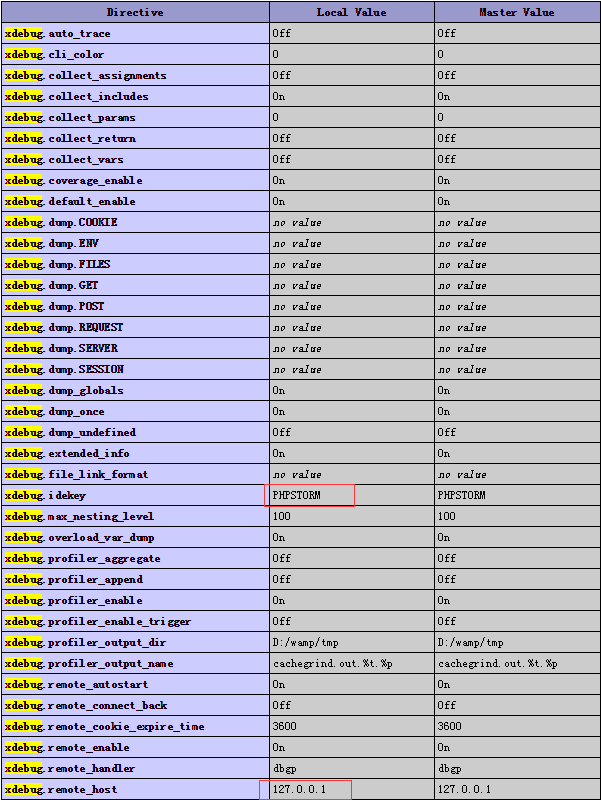
用phpinfo查看,出现如下配置,则代表修改成功

2.phpstorm设置
File->Settings->

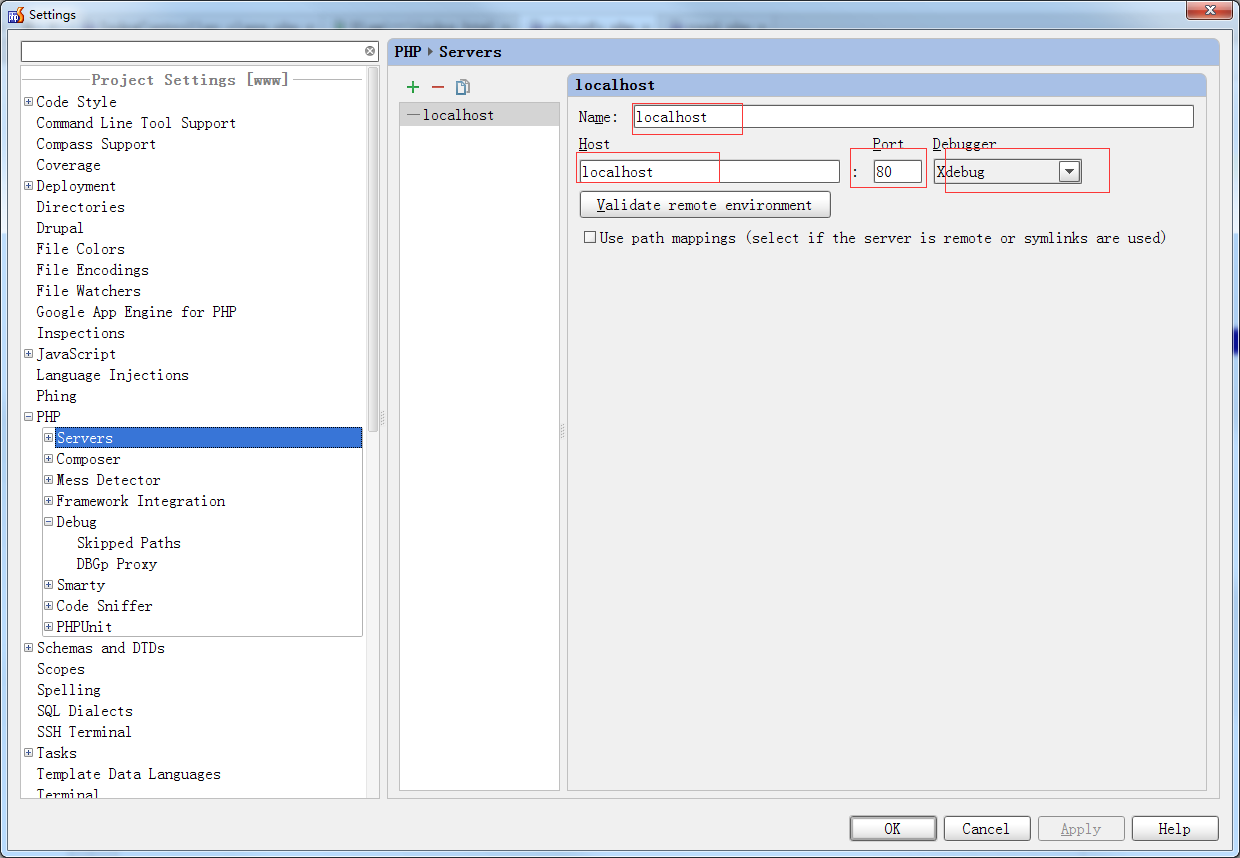
PHP->Server 新建一个 name为localhost Host为localhost Port:80,Debugger:Xdebug
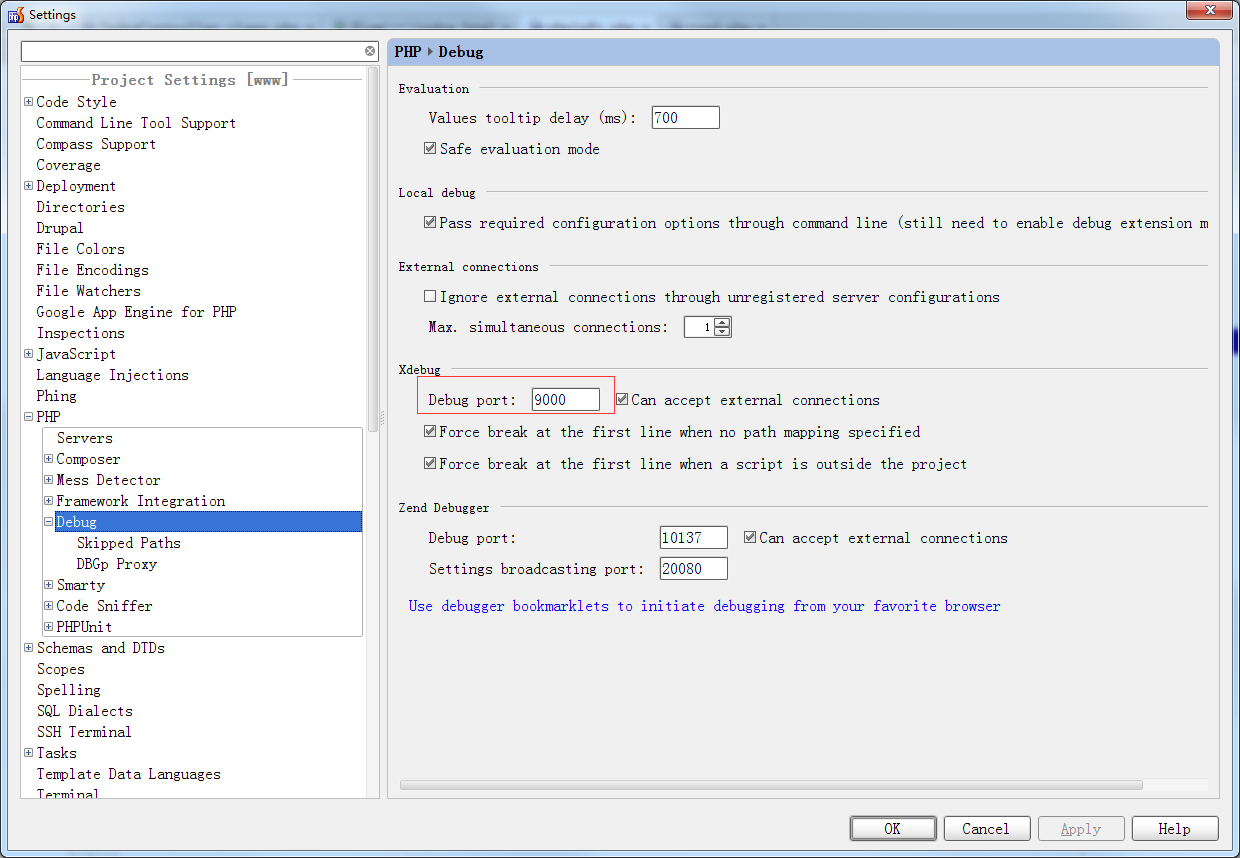
PHP->Debug页面 Debug Port设置为9000
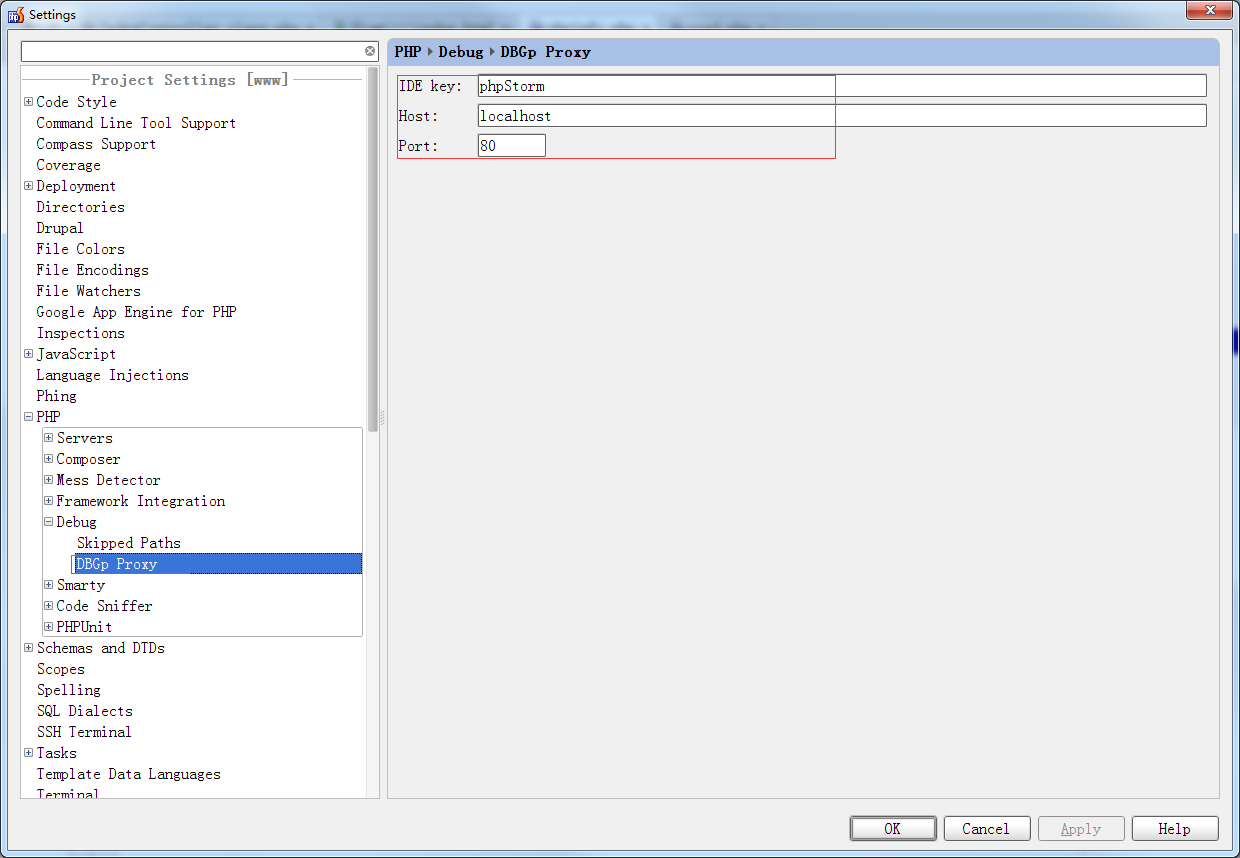
PHP标签下Debug->DBGp Proxy 配置如下
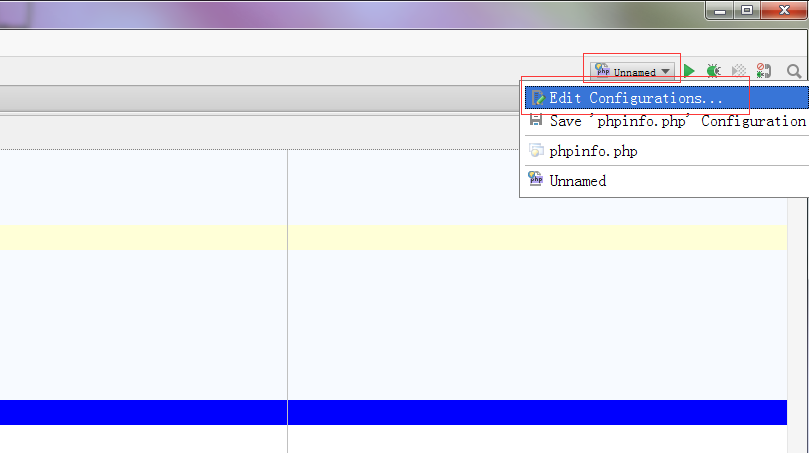
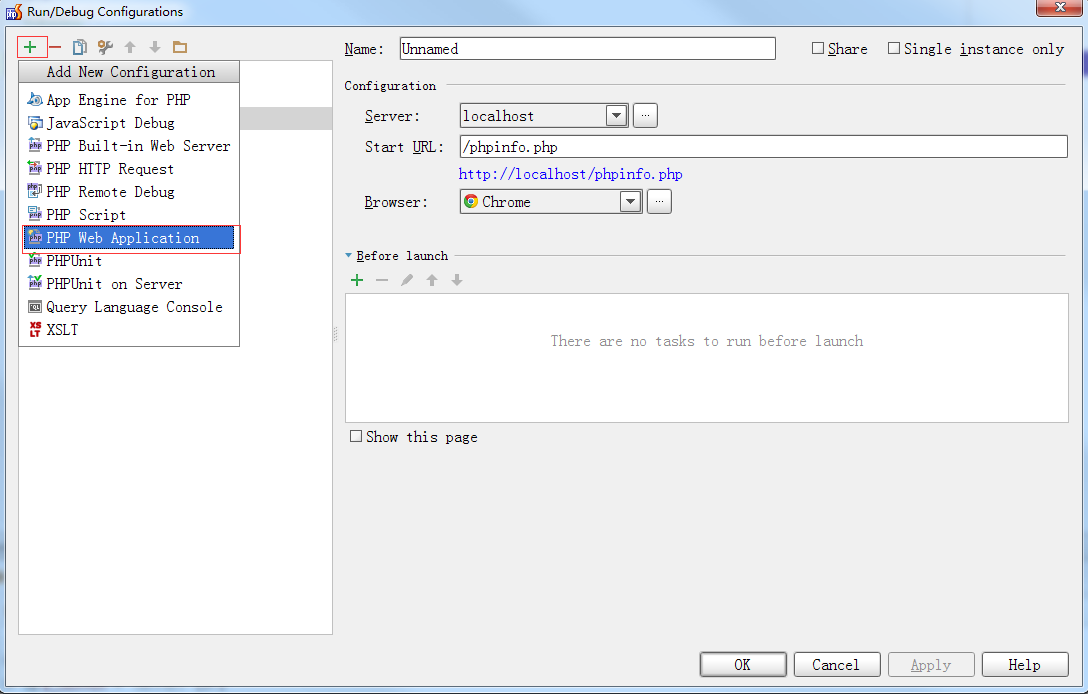
配置PHP Web Application

4.在chome上安装扩展,下载JetBrains IDE Support扩展,安装

5.可以进行断点调试了
设置断点

设置好断点后点击右上角绿色的小虫子按钮,phpstorm中会出现

如果没有出现断点调试信息,看是否打开了监听选项

接下来可以进行断点调试了

 浙公网安备 33010602011771号