
性能测试-grafana + prometheus + node_exporter
1、grafana安装
下载网址:https://grafana.com/grafana/download/7.4.3?platform=linux
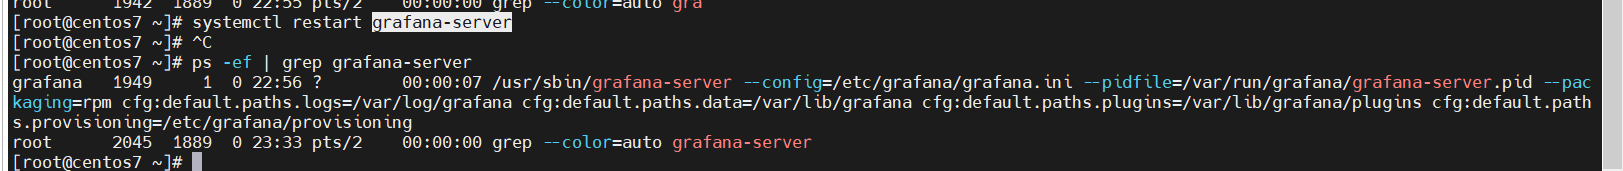
#下载
wget https://dl.grafana.com/enterprise/release/grafana-enterprise-7.4.3-1.x86_64.rpm
# 安装
sudo yum install grafana-enterprise-7.4.3-1.x86_64.rpm
#启动
systemctl restart grafana-server
ps -ef | grep grafana-server
2、grafana登录
访问grafana: http://grafana-server-ip:3000 admin admin
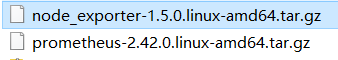
3、下载prometheus和node_exporter
https://prometheus.io/download/#node_exporter
4、安装node_exporter-安装在被测服务器
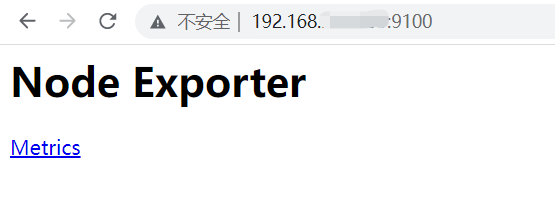
上传到被测服务器,用tar -zxvf *.tar.gz 解压安装包,然后启动 ./node_exporter
默认端口:9100 http://node_exporter_ip:9100,如下图所示表示启动正常
5、安装prometheus -不安装在被测服务器上
- tar.gz包,解压,然后启动 `./prometheus
- 默认端口: 9090 http://prometheus_ip:9090
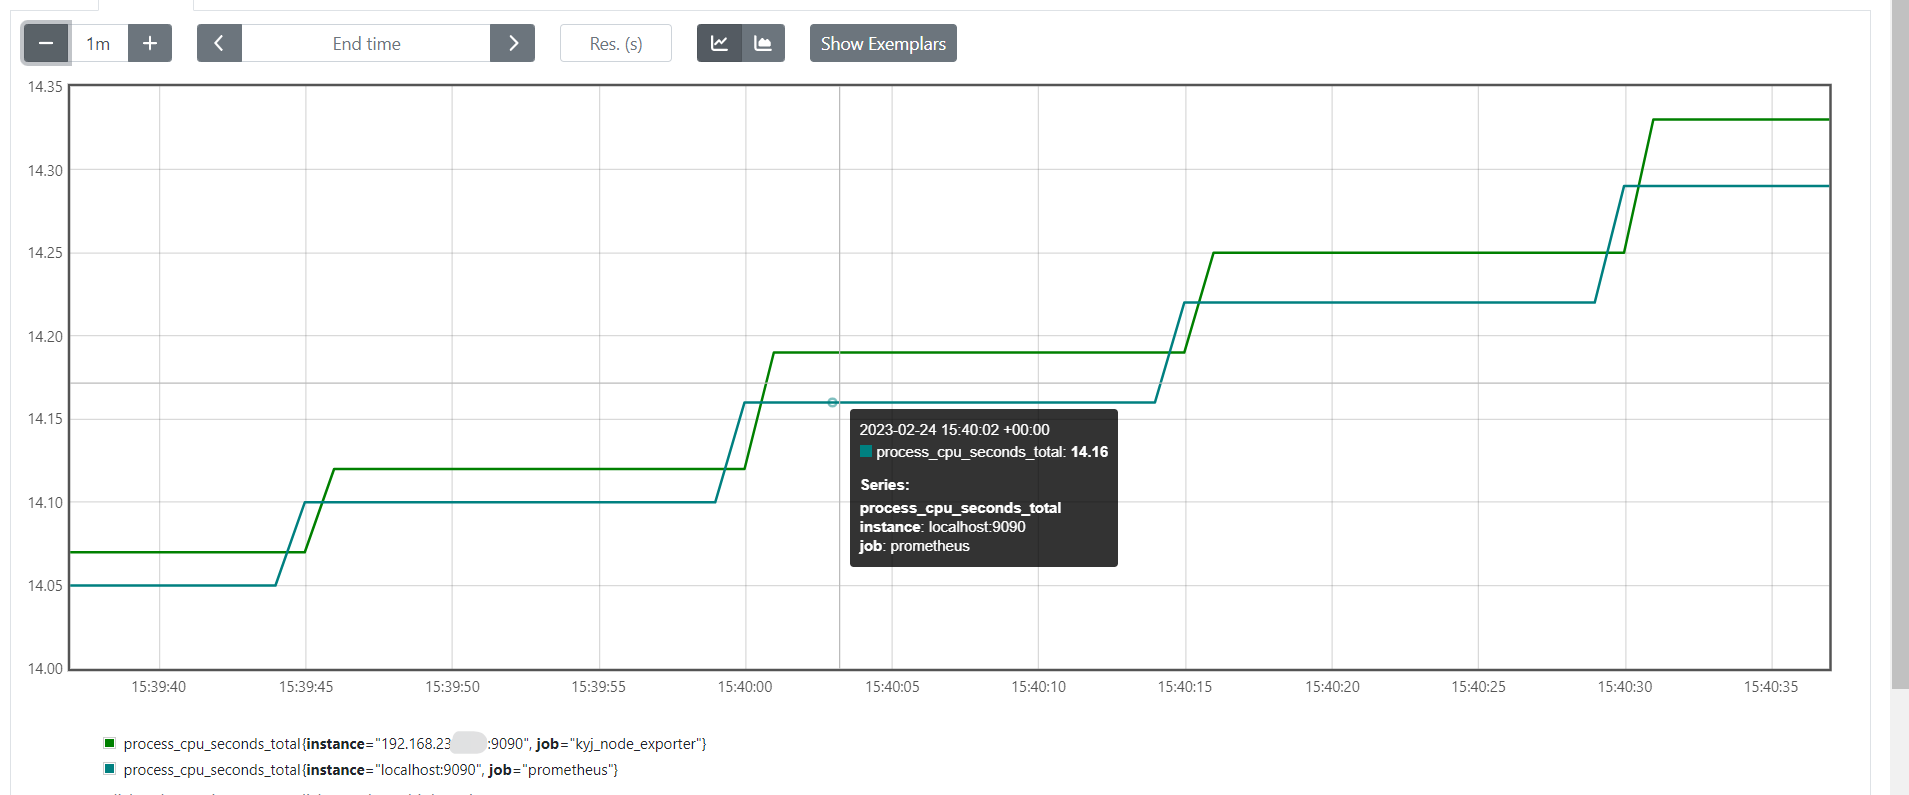
配置prometheus + node_exporter关系
修改prometheus配置文件: prometheus.yml ,如下,直接复制一份,修改
    - job_name: 'prometheus'

      # metrics_path defaults to '/metrics'
      # scheme defaults to 'http'.

      static_configs:
      - targets: ['localhost:9090']

   - job_name: 'kyj_node_exporter'
     static_configs:
     - targets: ['192.168***:9100','192.168.***:9100']
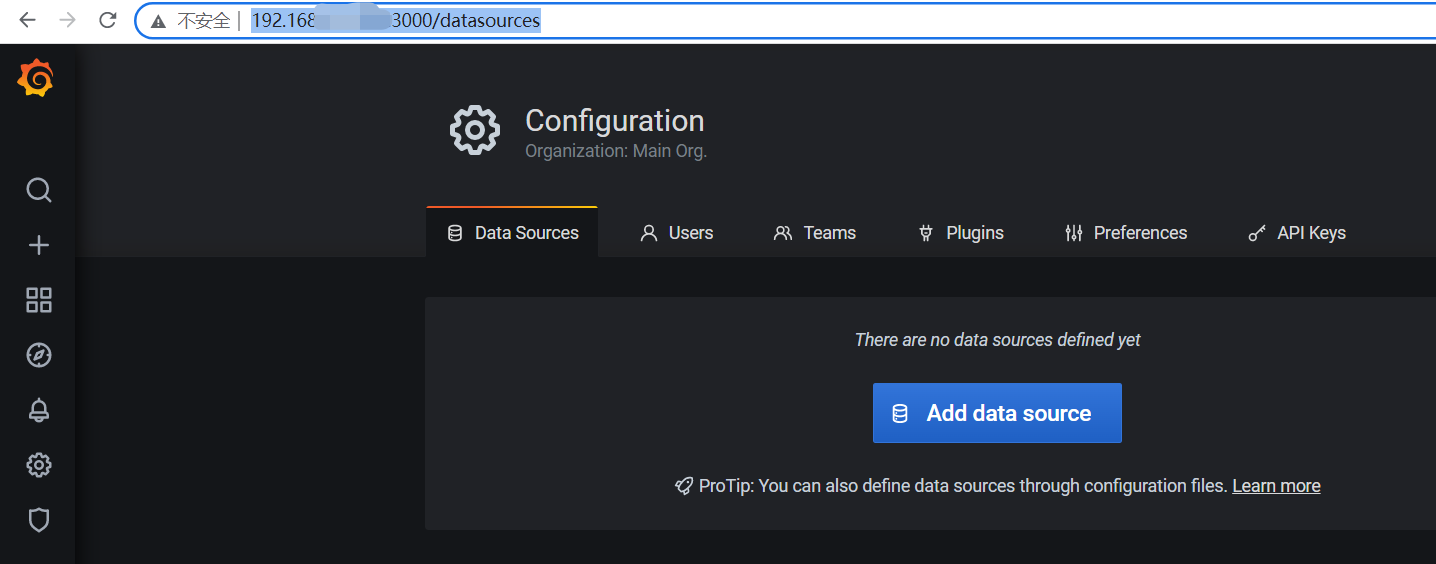
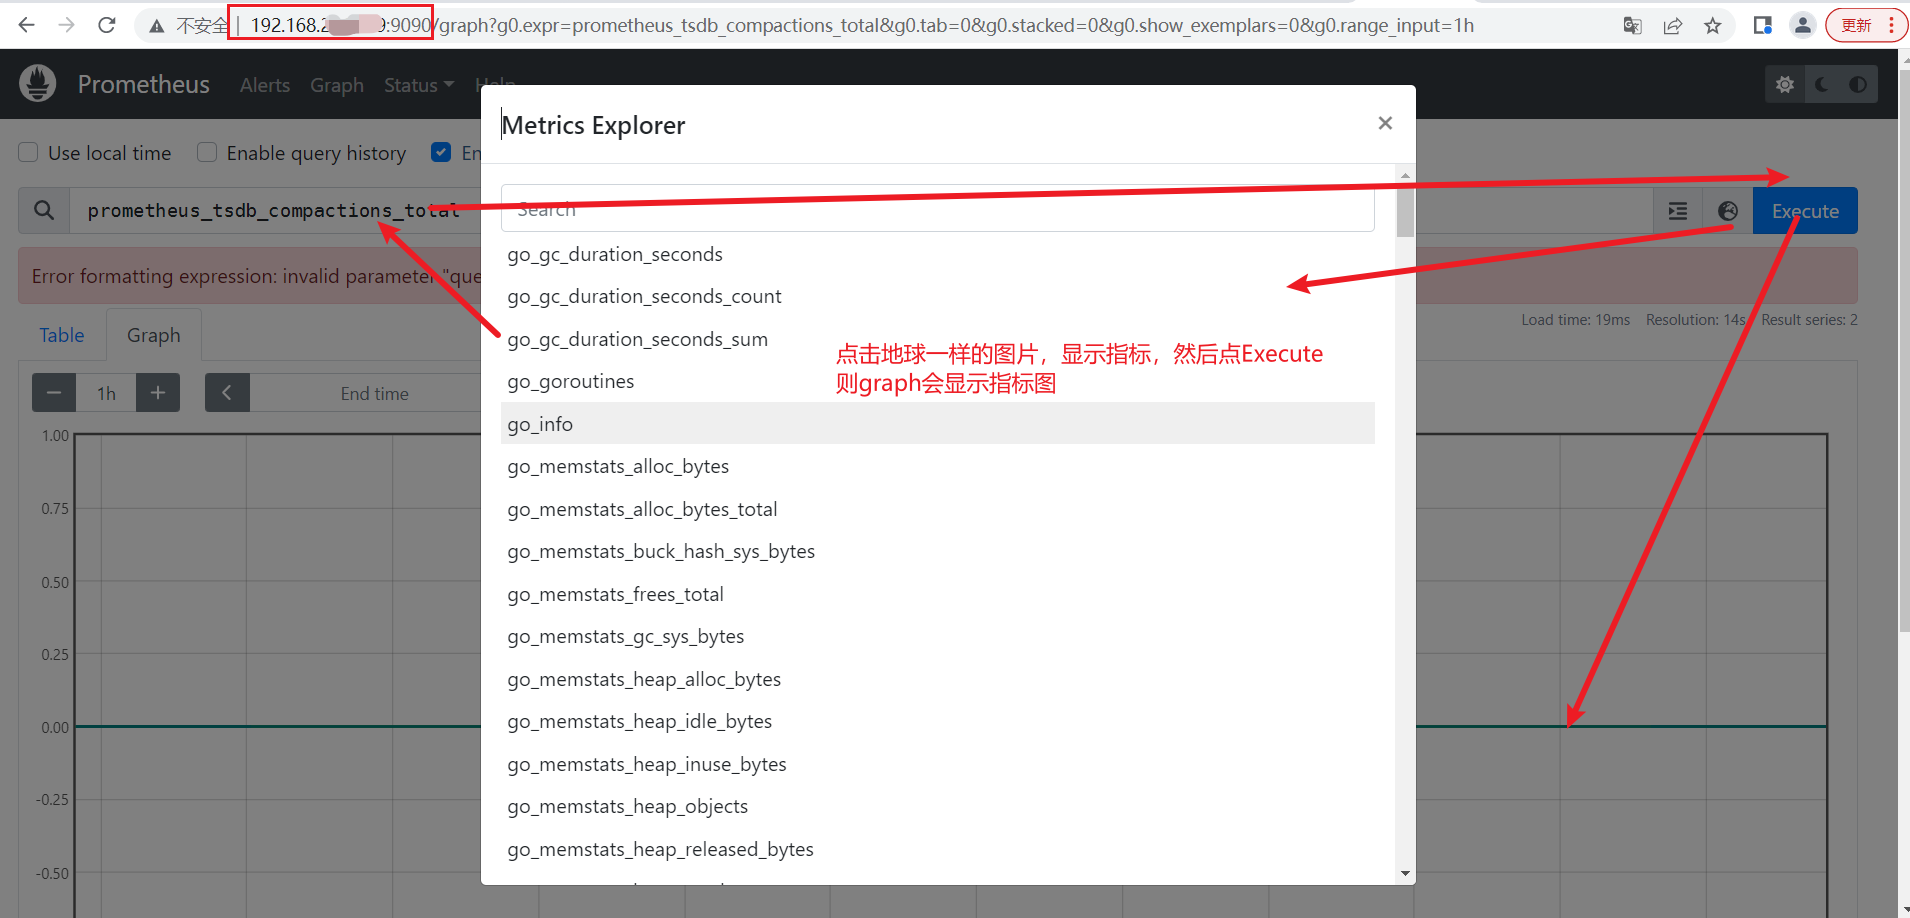
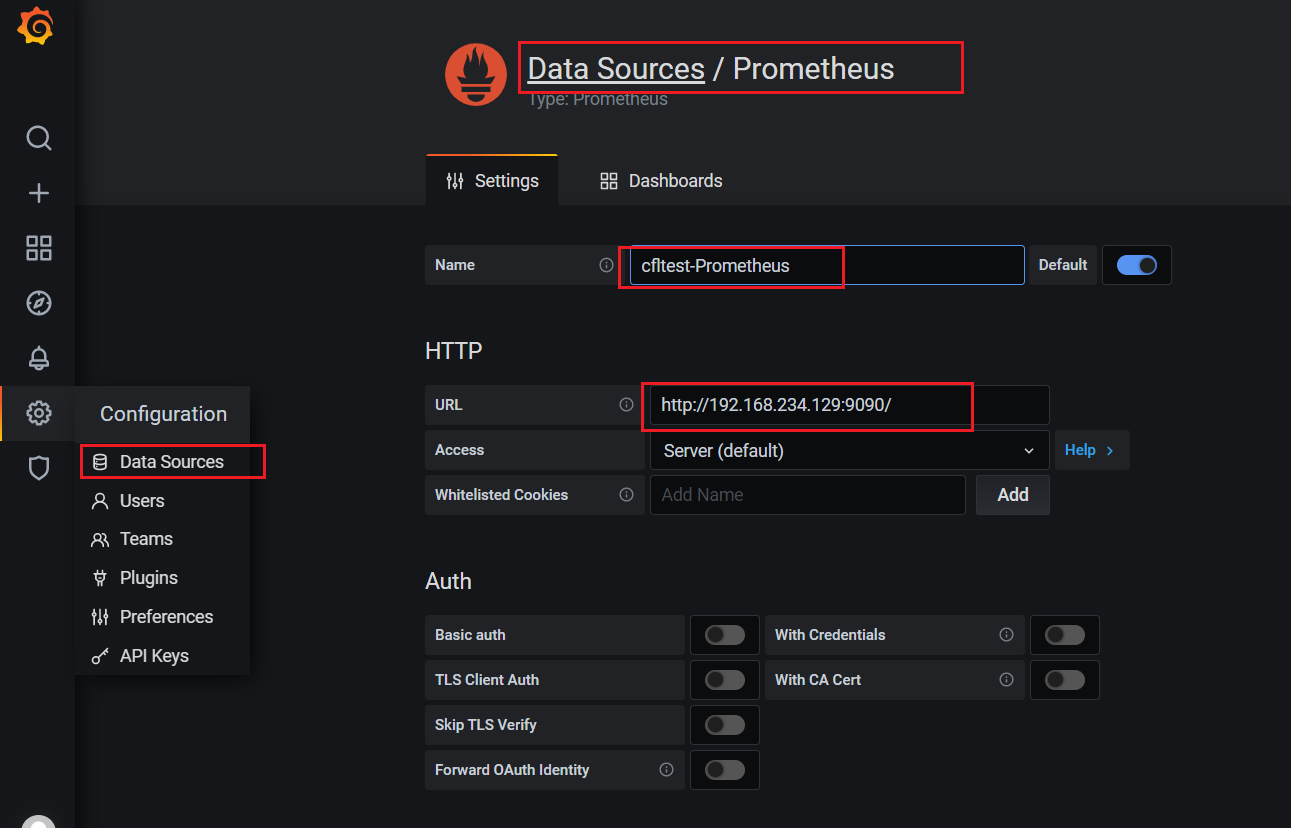
6、grafana配置展示prometheus中数据
grafana 中配置展示Prometheus中的数据
- 登录 admin admin
- add data source 选择 prometheus
- URL: http://prometheus_ip:9090
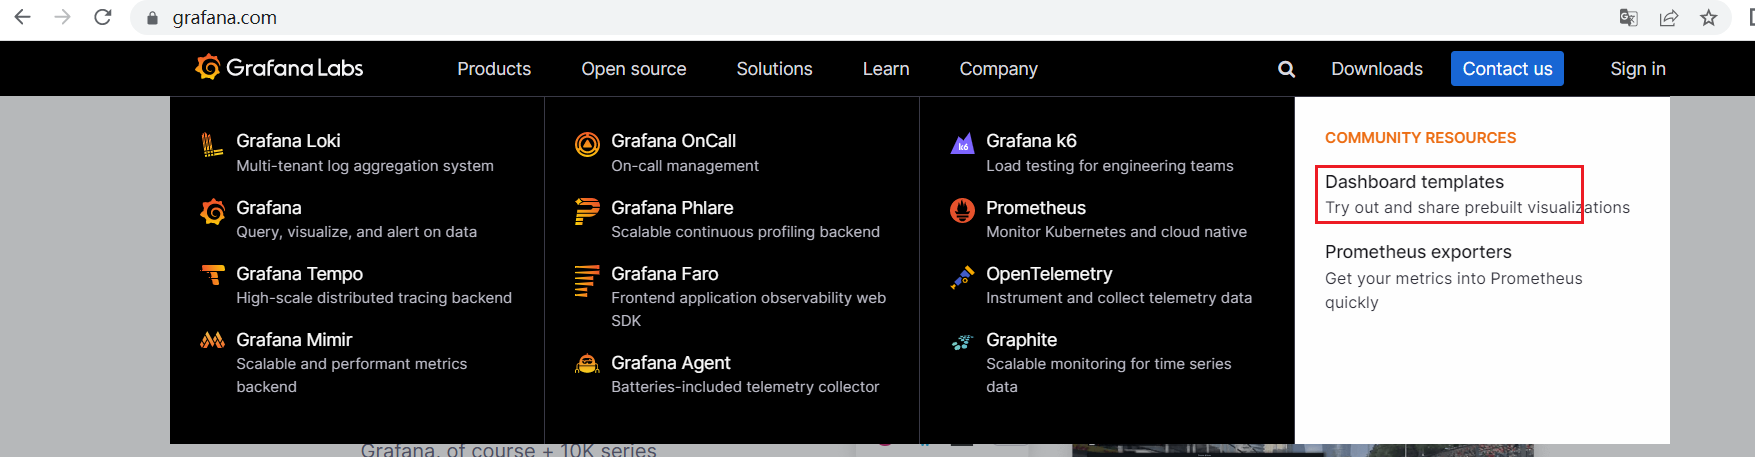
- import 模板
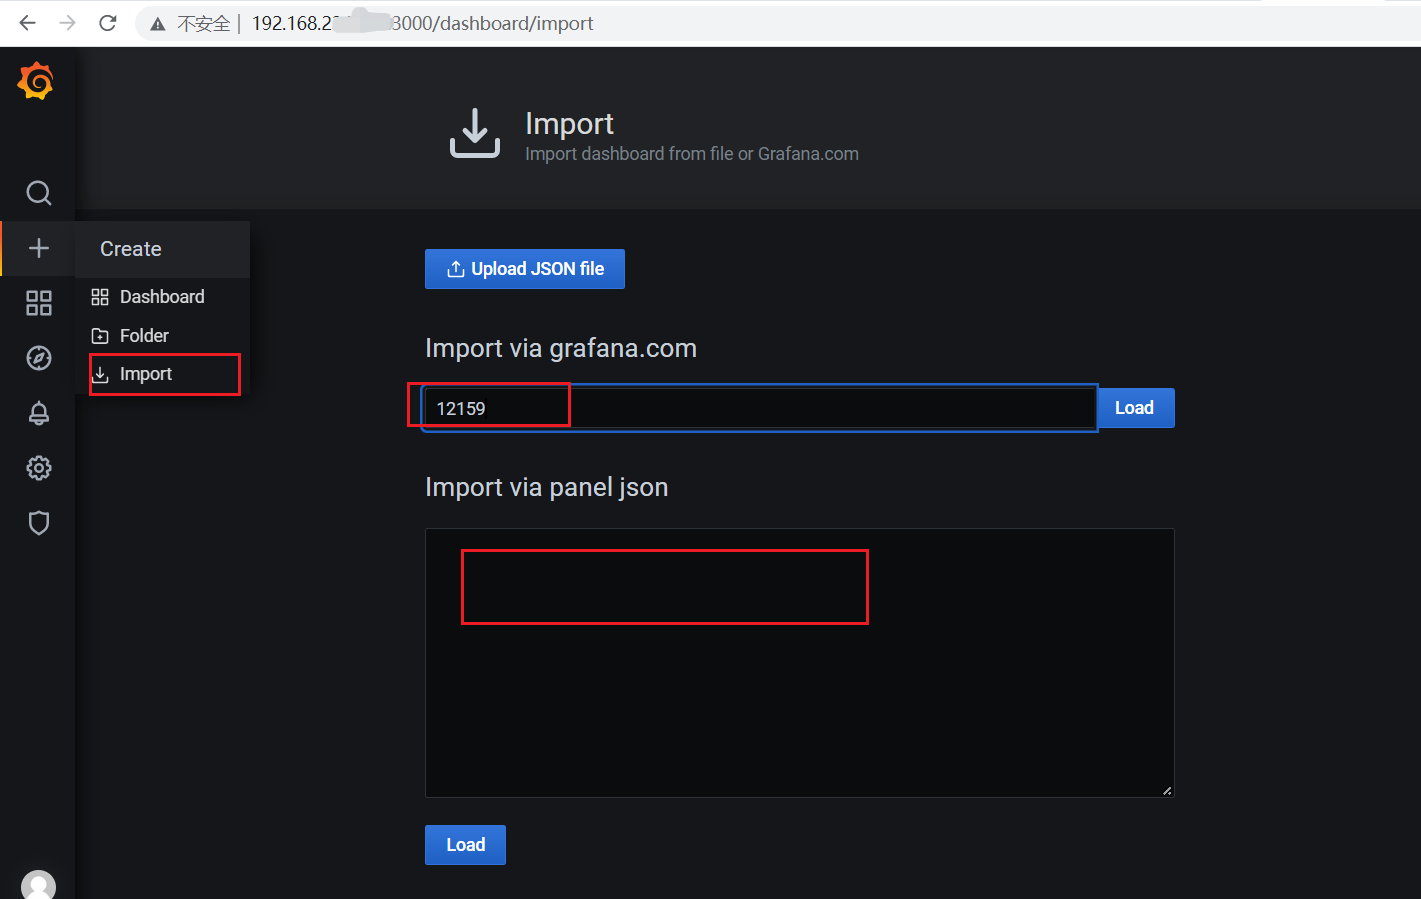
下载模板:https://grafana.com/grafana/dashboards/

 浙公网安备 33010602011771号