php调试利器Xhprof的安装与使用
一、安装xhprof
|
1
2
3
4
5
6
7
8
9
|
wget http://pecl.php.net/get/xhprof-0.9.4.tgztar -zxvf xhprof-0.9.4.tgzcd xhprof-0.9.4/extension/phpize./configure && make && make installorpecl install xhprof-beta |
二、配置PHP.ini
|
1
2
3
4
5
6
7
8
|
[xhprof]extension=xhprof.so;; directory used by default implementation of the iXHProfRuns; interface (namely, the XHProfRuns_Default class) for storing; XHProf runs.;;xhprof.output_dir=<directory_for_storing_xhprof_runs>xhprof.output_dir=/tmp/xhprof |
三、测试
|
1
2
3
|
server php-fpm restartyum install -y graphvizcp examples xhprof_html xhprof_lib /data/www/xhprof/ -R |
如果查看[View Full Callgraph]的时候,却提示如下:Error: either we can not find profile data for run_id 4d7f0bd99a12f or the threshold 0.01 is too small or you do not have ‘dot’ image generation utility installed
1、可能是PNG类库没有安装好,下载地址http://sourceforge.net/projects/libpng/files/
2、可能是PHP安全配置,比如开启了安全模式,执行系统的命令的函数给禁用了
测试代码如下
|
1
2
3
4
5
6
7
8
9
10
11
12
13
14
15
16
17
18
19
20
21
22
23
24
25
26
27
28
29
30
31
32
33
34
35
36
37
38
39
40
41
42
43
44
|
<?phpfunction bar($x) { if ($x > 0) { bar($x - 1); }}function foo() { for ($idx = 0; $idx < 5; $idx++) { bar($idx); $x = strlen("abc"); }}// start profilingxhprof_enable(XHPROF_FLAGS_CPU + XHPROF_FLAGS_MEMORY);// run programfoo();// stop profiler$xhprof_data = xhprof_disable();// display raw xhprof data for the profiler runprint_r($xhprof_data);$XHPROF_ROOT = realpath(dirname(__FILE__) .'/..');include_once $XHPROF_ROOT . "/xhprof_lib/utils/xhprof_lib.php";include_once $XHPROF_ROOT . "/xhprof_lib/utils/xhprof_runs.php";// save raw data for this profiler run using default// implementation of iXHProfRuns.$xhprof_runs = new XHProfRuns_Default();// save the run under a namespace "xhprof_foo"$run_id = $xhprof_runs->save_run($xhprof_data, "xhprof_foo");echo "---------------\n". "Assuming you have set up the http based UI for \n". "XHProf at some address, you can view run at \n". "http://<xhprof-ui-address>/index.php?run=$run_id&source=xhprof_foo\n". "---------------\n"; |
运行结果


参数说明
|
1
2
3
4
5
6
7
8
9
10
11
12
13
14
15
16
17
18
19
20
21
22
23
24
25
26
27
28
29
30
31
32
33
34
35
36
37
38
39
40
|
Inclusive Time (or Subtree Time): Includes time spent in the function as well as in descendant functions called from a given function.Exclusive Time/Self Time: Measures time spent in the function itself. Does not include time in descendant functions.Wall Time: a.k.a. Elapsed time or wall clock time.CPU Time: CPU time in user space + CPU time in kernel space主要指标:Inclusive Time (或子树时间):包括子函数所有执行时间。 Exclusive Time/Self Time:函数执行本身花费的时间,不包括子树执行时间。 Wall时间:花去了的时间或挂钟时间。 CPU时间:用户耗的时间+内核耗的时间 # 如果xhprof_enable函数写作:xhprof_enable(XHPROF_FLAGS_CPU + XHPROF_FLAGS_MEMORY)可以输出更多指标。 Function Name 函数名 Calls 调用次数 Calls% 调用百分比 # 消耗时间 Incl. Wall Time (microsec) 调用的包括子函数所有花费时间 以微秒算(一百万分之一秒) IWall% 调用的包括子函数所有花费时间的百分比 Excl. Wall Time (microsec) 函数执行本身花费的时间,不包括子树执行时间,以微秒算(一百万分之一秒) EWall% 函数执行本身花费的时间的百分比,不包括子树执行时间 # 消耗CPU Incl. CPU(microsecs) 调用的包括子函数所有花费的cpu时间。减Incl. Wall Time即为等待cpu的时间 ICpu% Incl. CPU(microsecs)的百分比 Excl. CPU(microsec) 函数执行本身花费的cpu时间,不包括子树执行时间,以微秒算(一百万分之一秒)。 ECPU% Excl. CPU(microsec)的百分比 # 消耗内存 Incl.MemUse(bytes) 包括子函数执行使用的内存。 IMemUse% Incl.MemUse(bytes)的百分比 Excl.MemUse(bytes) 函数执行本身内存,以字节算 EMemUse% Excl.MemUse(bytes)的百分比 # 消耗内存峰值 Incl.PeakMemUse(bytes) Incl.MemUse的峰值 IPeakMemUse% Incl.PeakMemUse(bytes) 的峰值百分比 Excl.PeakMemUse(bytes) Excl.MemUse的峰值 EPeakMemUse% EMemUse% 峰值百分比 |
四、更好的注入方式
了解了上面这些,其实就已经可以将xhprof整合到任何我们已有的项目中去了,目前大部分MVC框架都有唯一的入口文件,只需要在入口文件的开始处注入xhprof的逻辑
|
1
2
3
4
5
6
7
8
9
10
11
12
13
14
15
16
17
18
19
20
21
22
23
|
<?php//启动xhprofxhprof_enable(XHPROF_FLAGS_CPU + XHPROF_FLAGS_MEMORY);register_shutdown_function(function() { $xhprof_data = xhprof_disable(); //让数据收集程序在后台运行 if (function_exists('fastcgi_finish_request')) { fastcgi_finish_request(); } $XHPROF_ROOT = realpath(dirname(__FILE__) ); include_once $XHPROF_ROOT . "/xhprof_lib/utils/xhprof_lib.php"; include_once $XHPROF_ROOT . "/xhprof_lib/utils/xhprof_runs.php"; //保存统计数据,生成统计ID和source名称 $xhprof_runs = new XHProfRuns_Default(); $run_id = $xhprof_runs->save_run($xhprof_data, "xhprof_foo"); //source名称是xhprof_foo file_put_contents("/data/www/x.test.com/2.txt","http://x.test.com:8081/xhprof/xhprof_html/index.php?run=" . $run_id . "&source=xhprof_foo\n",FILE_APPEND);}); |
但是这样免不了要修改项目的源代码,其实php本身就提供了更好的注入方式,比如将上述逻辑保存为/opt/inject.php,然后修改php fpm配置文件
|
1
2
|
//修改auto_prepend_file配置auto_prepend_file = /opt/inject.php |
或者修改php-fpm配置
|
1
|
php_admin_value[auto_prepend_file] = /opt/inject.php |
或者修改nginx配置
|
1
|
fastcgi_param PHP_VALUE "auto_prepend_file=/opt/inject.php"; |
xhprof.io还是xhpgui,注入代码后我们还需要实现保存xhprof数据以及展示数据的UI,听起来似乎又是一大堆工作,有现成的轮子可以用吗?经过搜索和比较,貌似比较好的选择有xhprof.io以及xhpgui。
xhprof.io配置
|
1
2
3
4
|
git clone https://github.com/gajus/xhprof.iocd xhprof.io/composer installcp xhprof/includes/config.inc.sample.php xhprof/includes/config.inc.php |
修改xhprof/includes/config.inc.php
|
1
2
3
4
5
6
|
//在MySQL中建立xhprof.io数据库,假设数据库名为xhprof,然后导入xhprof/setup/database.sql//配置文件config.inc.php中需要调整'url_base' => 'http://x.test.com:8081/xhprof.io/', 这是xhprof.io界面所在路径'pdo' => new PDO('mysql:dbname=xhprof;host=localhost;charset=utf8', 'root', 'password'), 根据MySQL实际情况调整配置//enable 这是一个匿名函数,当匿名函数返回true时启用xhprof数据收集 |
测试地址:https://dev.anuary.com/8d50658e-f8e0-5832-9e82-6b9e8aa940ac/?xhprof[template]=request&xhprof[query][request_id]=108151
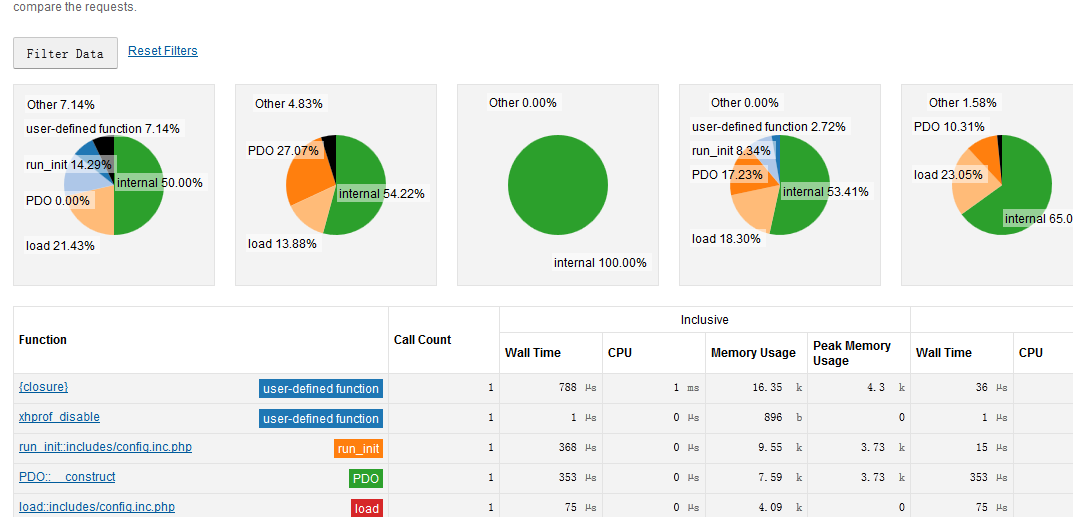
五、框架测试
1、ThinkPHP原生框架

调用关系图

2、加载程序的TP框架

调用关系图

3、CI原生框架

调用关系图

4、YII原生框架

调用关系图

具体哪个函数很慢,都是可以看的很清楚
参考文章
http://pecl.php.net/package/xhprof
http://mirror.facebook.net/facebook/xhprof/doc.html
https://github.com/facebook/xhprof
- 作者:踏雪无痕
- 出处:http://www.cnblogs.com/chenpingzhao/
- 本文版权归作者和博客园共有,如需转载,请联系 pingzhao1990#163.com


 浙公网安备 33010602011771号