fac 相关仪表盘笔记
依赖安装
dash==2.18.2
feffery_antd_charts==0.1.5
feffery_antd_components==0.3.15
feffery_dash_utils==0.2.3
feffery_utils_components==0.2.0rc27
fpdf2
Pillow
基础模板相关演示
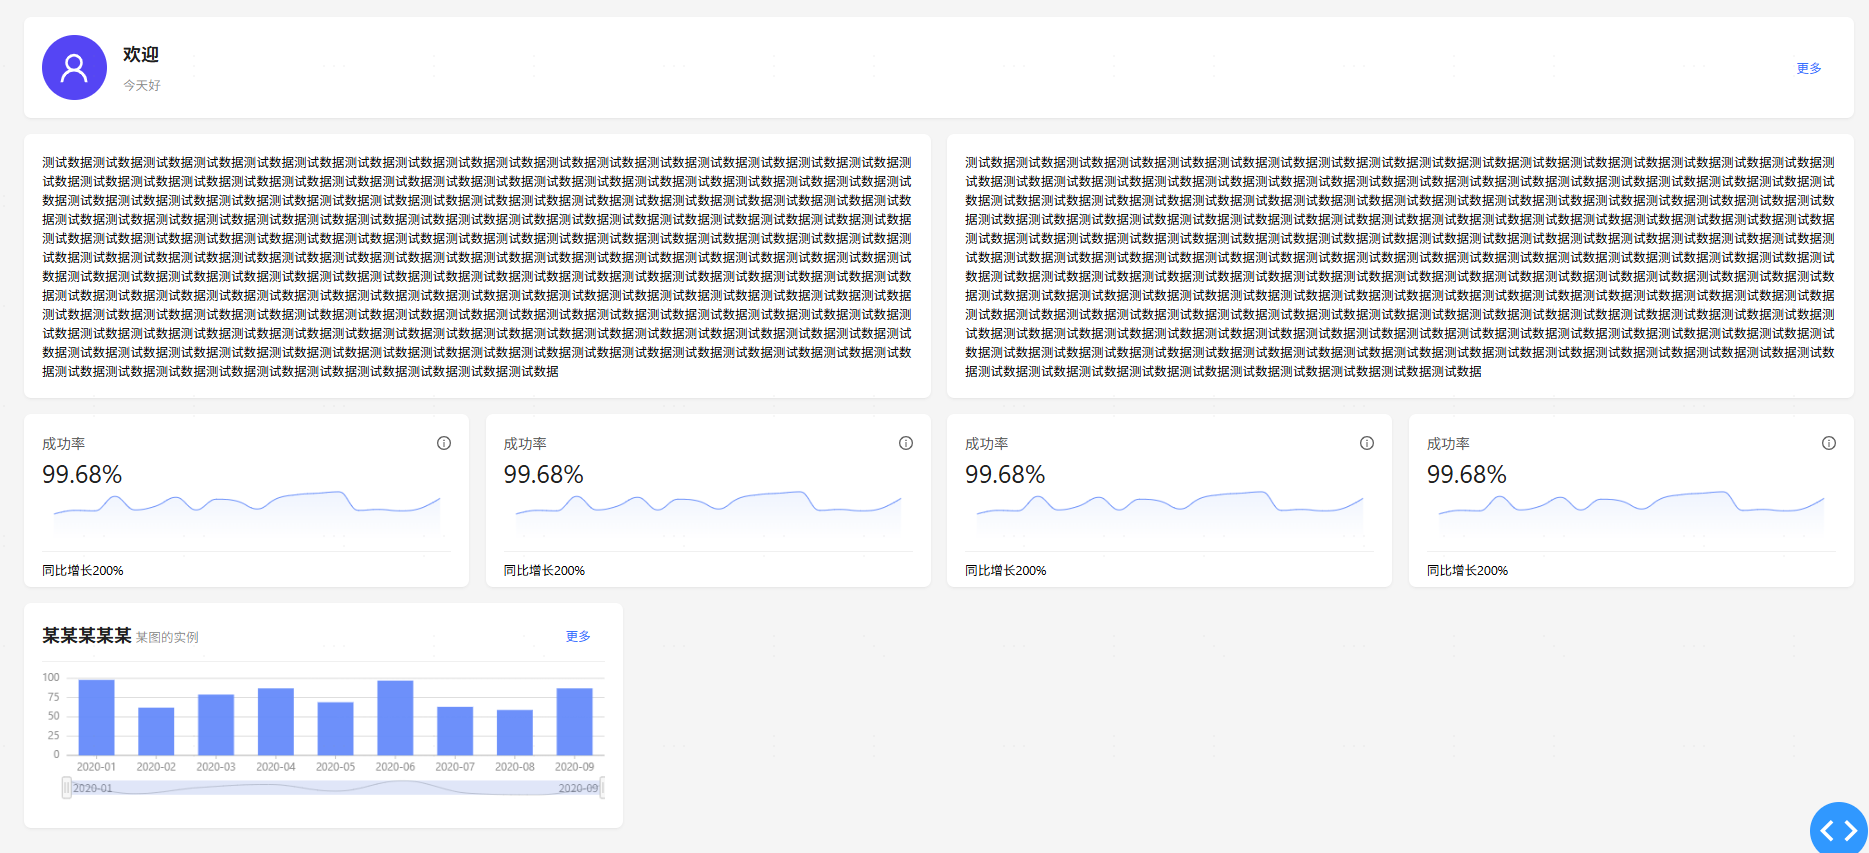
相关的方法, 几个默认的卡片
欢迎卡片, 背景卡片, 指标卡片, 简单图表卡片
from feffery_dash_utils.template_utils.dashboard_components import (
    welcome_card,
    blank_card,
    index_card,
    simple_chart_card
)
代码
import dash
import random
from dash import html
import feffery_antd_charts as fact
import feffery_antd_components as fac
from feffery_dash_utils.style_utils import style

from feffery_dash_utils.template_utils.dashboard_components import (
    welcome_card,
    blank_card,
    index_card,
    simple_chart_card
)

app = dash.Dash(__name__)

app.layout = html.Div(
    [
        fac.AntdRow(
            [
                # 欢迎卡片
                fac.AntdCol(
                    welcome_card(
                        title="欢迎",
                        description="今天好",
                        avatar=fac.AntdAvatar(
                            icon="antd-user", size=72, style=style(background="#4551f5"),
                        ),
                        extra=fac.AntdButton("更多", type="link")
                    ),
                    span=24,
                ),
                # 空白卡片
                fac.AntdCol(blank_card("测试数据" * 200), span=12),
                fac.AntdCol(blank_card("测试数据" * 200), span=12),
                # 指标卡片
                *([fac.AntdCol(index_card(
                    index_name="成功率", index_value="99.68%",
                    index_description="指标描述",
                    extra_content=fact.AntdTinyArea(
                        data=[random.randint(50, 100) for _ in range(20)],
                        height=60,
                        smooth=True,
                    ),
                    footer_content="同比增长200%"
                ), span=6)] * 4),
                # 简单图标卡片
                fac.AntdCol(simple_chart_card(
                    title="某某某某某",
                    description="某图的实例",
                    chart=fact.AntdColumn(
                        data=[{'date': f'2020-0{i}', 'y': random.randint(50, 100)} for i in range(1, 10)],
                        xField='date',
                        yField='y',
                        slider={},
                    ),
                    extra=fac.AntdButton("更多", type="link"),
                    height=250,
                ), span=8),

            ],
            gutter=[18, 18]
        )
    ],
    style=style(padding=50, background="#f5f5f5", minHeight="calc(100vh - 100px)")
)

if __name__ == '__main__':
    app.run(debug=True)
演示效果
演示仪表盘效果展示
# 这是一个最基础的空白Dash应用模板,由feffery-dash-snippets自动生成 import dash import random from dash import html, set_props import feffery_antd_charts as fact from dash.dependencies import Input import feffery_antd_components as fac from feffery_dash_utils.style_utils import style from feffery_dash_utils.template_utils.dashboard_components import ( welcome_card, blank_card, index_card, simple_chart_card, ) app = dash.Dash(__name__) def layout(): return html.Div( [ # 消息提示输出目标 fac.Fragment(id="message-target"), # 回到顶部 fac.AntdBackTop(), # 仪表盘网格布局 fac.AntdRow( [ # 欢迎卡片 fac.AntdCol( welcome_card( title="欢迎访问本应用,用户:张三", description=fac.AntdText( [ "您有5个事项待处理,点击", html.A("此处", id="demo-link1"), "查看。", ] ), avatar=fac.AntdAvatar( src="/assets/demo-avatar.png", mode="image", size=72, style=style(background="#1890ff"), ), extra=fac.AntdButton( "更多信息", id="demo-link2", type="link" ), ), span=24, ), # 指标卡片示例 fac.AntdCol( index_card( index_name="总销售额", index_value="¥ 126560", index_description="这是总销售额的指标描述示例内容", extra_content=fac.AntdText( [ "周同比12%", fac.AntdIcon( icon="antd-caret-up", style=style(color="#f5222d"), ), ",日同比11%", fac.AntdIcon( icon="antd-caret-down", style=style(color="#52c41a"), ), ] ), footer_content="日销售额 ¥12423", ), span=6, ), fac.AntdCol( index_card( index_name="访问量", index_value=8846, index_description="这是访问量的指标描述示例内容", extra_content=fact.AntdTinyArea( data=[random.randint(50, 100) for _ in range(20)], height=60, smooth=True, ), footer_content="日访问量 1234", ), span=6, ), fac.AntdCol( index_card( index_name="支付笔数", index_value=6560, index_description="这是支付笔数的指标描述示例内容", extra_content=fact.AntdTinyColumn( data=[random.randint(50, 100) for _ in range(20)], height=60, color="#2389ff", columnWidthRatio=0.75, ), footer_content="转化率 60%", ), span=6, ), fac.AntdCol( index_card( index_name="运营活动效果", index_value="78%", index_description="这是运营活动效果的指标描述示例内容", extra_content=fac.AntdCenter( fac.AntdProgress( percent=78, status="active", strokeColor={"from": "#128ee7", "to": "#6cc085"}, ), style=style(height="100%"), ), footer_content=fac.AntdText( [ "周同比8%", fac.AntdIcon( icon="antd-caret-up", style=style(color="#f5222d"), ), ",日同比3%", fac.AntdIcon( icon="antd-caret-down", style=style(color="#52c41a"), ), ] ), ), span=6, ), # 图表卡片示例 fac.AntdCol( simple_chart_card( title="销售额类别占比", description="时间范围:当月", chart=fact.AntdPie( data=[ { "type": "家用电器", "value": 4544, }, { "type": "食用酒水", "value": 3321, }, { "type": "个护健康", "value": 3113, }, { "type": "服饰箱包", "value": 2341, }, { "type": "母婴产品", "value": 1231, }, { "type": "其他", "value": 1231, }, ], colorField="type", angleField="value", radius=0.8, innerRadius=0.6, label={"type": "spider"}, ), height=450, ), span=12, ), fac.AntdCol( simple_chart_card( title="流量转化情况", description="时间范围:当月", chart=fact.AntdColumn( data=[ { "action": "浏览网站", "pv": 50000, }, { "action": "放入购物车", "pv": 35000, }, { "action": "生成订单", "pv": 25000, }, { "action": "支付订单", "pv": 15000, }, { "action": "完成交易", "pv": 8500, }, ], xField="action", yField="pv", conversionTag={}, color="#2e8fff", ), height=450, ), span=12, ), fac.AntdCol( simple_chart_card( title="流量转化具体链路", description="时间范围:当月", chart=fact.AntdSankey( data=[ { "source": "首次打开", "target": "首页 UV", "value": 160, }, { "source": "结果页", "target": "首页 UV", "value": 40, }, { "source": "验证页", "target": "首页 UV", "value": 10, }, { "source": "我的", "target": "首页 UV", "value": 10, }, {"source": "朋友", "target": "首页 UV", "value": 8}, { "source": "其他来源", "target": "首页 UV", "value": 27, }, { "source": "首页 UV", "target": "理财", "value": 30, }, { "source": "首页 UV", "target": "扫一扫", "value": 40, }, { "source": "首页 UV", "target": "服务", "value": 35, }, { "source": "首页 UV", "target": "蚂蚁森林", "value": 25, }, { "source": "首页 UV", "target": "跳失", "value": 10, }, { "source": "首页 UV", "target": "借呗", "value": 30, }, { "source": "首页 UV", "target": "花呗", "value": 40, }, { "source": "首页 UV", "target": "其他流向", "value": 45, }, ], sourceField="source", targetField="target", weightField="value", nodeWidthRatio=0.008, nodePaddingRatio=0.03, nodeDraggable=True, ), height=375, ), span=24, ), fac.AntdCol( simple_chart_card( title="内容运营情况", description="时间范围:近10天", chart=fact.AntdArea( data=[ { "date": date, "type": type, "value": random.randint(50, 1000), } for date in [ "03-01", "03-02", "03-03", "03-04", "03-05", "03-06", "03-07", "03-08", "03-09", "03-10", ] for type in [ "内容生产量", "内容点击量", "内容曝光量", "活跃用户数", ] ], xField="date", yField="value", seriesField="type", smooth=True, isStack=True, legend={"position": "top"}, ), height=500, ), span=16, ), fac.AntdCol( simple_chart_card( title="近期热门内容", description="时间范围:近10天", chart=fac.AntdTable( columns=[ { "title": "标题", "dataIndex": "title", "key": "title", }, { "title": "点击量", "dataIndex": "click", "key": "click", }, { "title": "内容链接", "dataIndex": "link", "key": "link", "renderOptions": { "renderType": "link", }, }, ], data=[ { "title": "示例内容标题xxx", "click": random.randint(100, 10000), "link": { "content": "点击访问", "href": "https://fact.feffery.tech/", }, } for i in range(18) ], size="small", pagination=False, tableLayout="fixed", maxHeight=325, bordered=True, ), height=500, ), span=8, ), # 空白卡片示例 fac.AntdCol( blank_card( fac.AntdCenter( fac.AntdText( [ fac.AntdText("玩转Dash", italic=True), "知识星球出品", ] ) ) ), span=24, ), ], gutter=[18, 18], ), ], style=style( padding=50, background="#f5f5f5", minHeight="100vh", boxSizing="border-box" ), ) app.layout = layout @app.callback([Input("demo-link1", "n_clicks"), Input("demo-link2", "nClicks")]) def link_click_demo(*args): """链接点击交互演示""" set_props( "message-target", { "children": fac.AntdMessage( content="你点击了链接 " + dash.ctx.triggered_id, type="info" ) }, ) if __name__ == "__main__": app.run(debug=False)
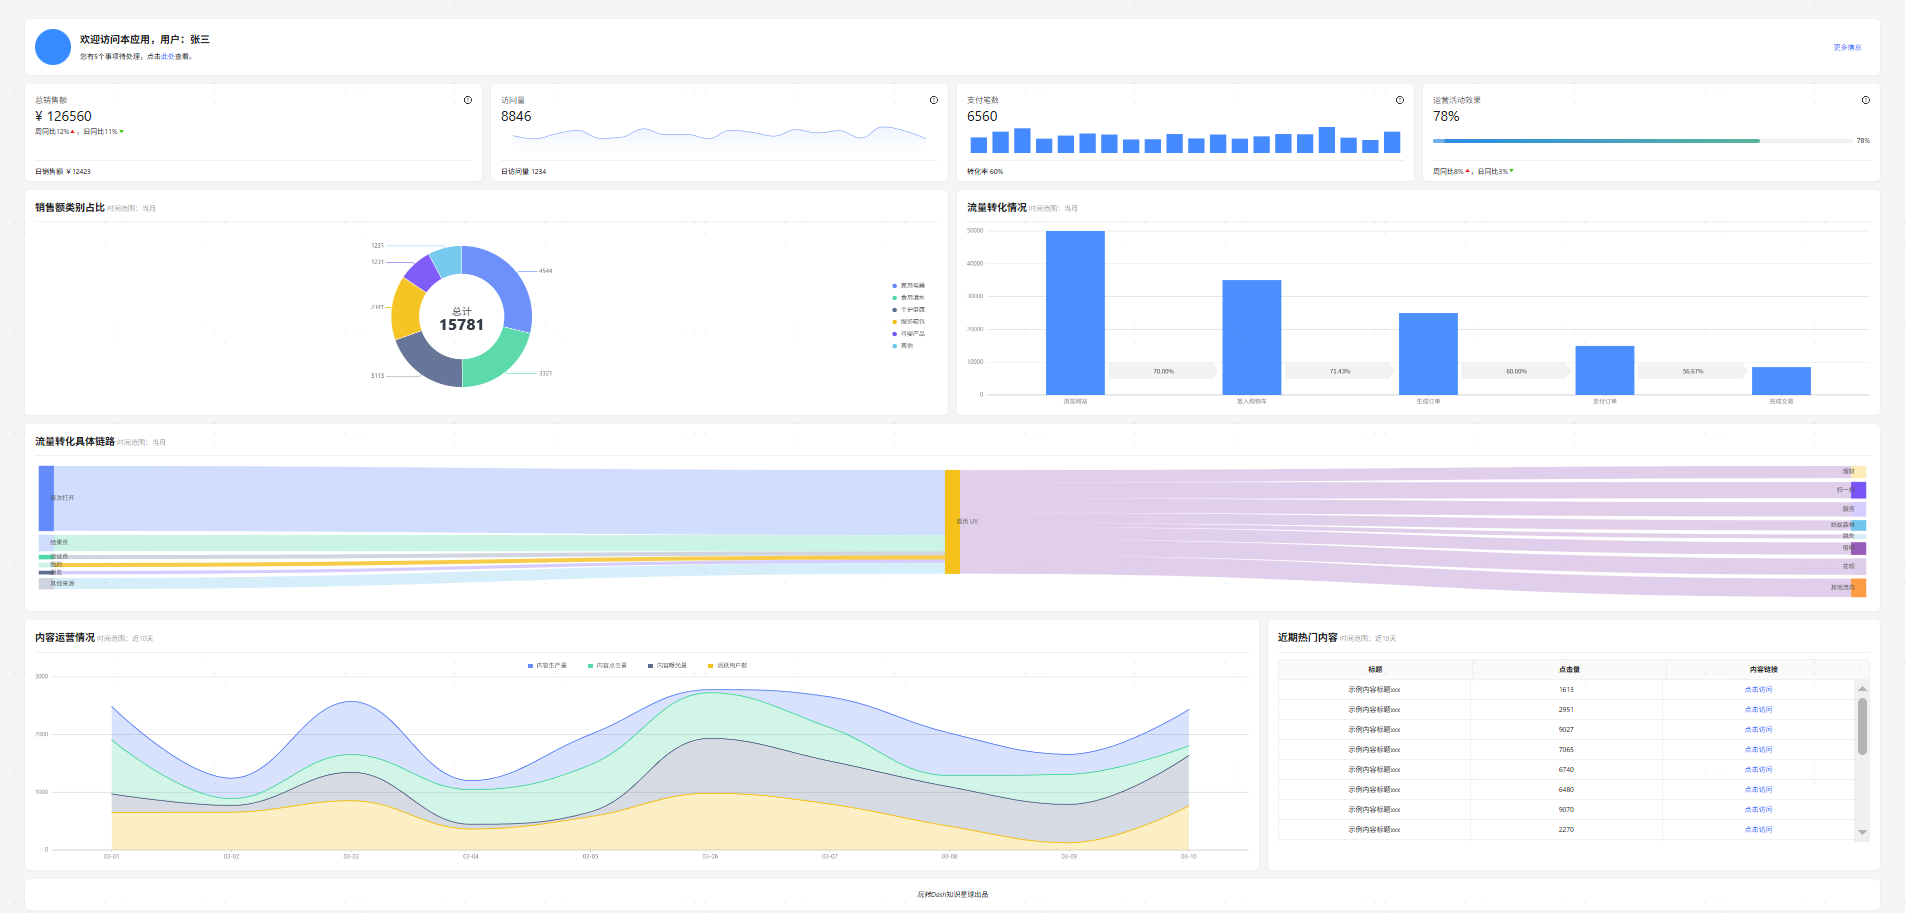
演示效果
所有的图可进行交互, 单选多选反选等
仪表盘数据交互式切换案例
import time import random import dash from dash import html from typing import Literal import feffery_antd_charts as fact import feffery_antd_components as fac from dash.dependencies import Input, Output from feffery_dash_utils.style_utils import style from feffery_dash_utils.template_utils.dashboard_components import blank_card, simple_chart_card def sales_data(series: Literal["全部渠道", "线上", "门店"]): """模拟销售额示例数据切换""" if series == "全部渠道": return [ {"type": "家用电器", "value": random.randint(1, 1000)}, {"type": "食用酒水", "value": random.randint(1, 1000)}, {"type": "个护健康", "value": random.randint(1, 1000)}, {"type": "服饰箱包", "value": random.randint(1, 1000)}, {"type": "母婴产品", "value": random.randint(1, 1000)}, {"type": "其他", "value": random.randint(1, 1000)}, ] elif series == "线上": return [ {"type": "家用电器", "value": random.randint(1, 200)}, {"type": "食用酒水", "value": random.randint(1, 200)}, {"type": "个护健康", "value": random.randint(1, 200)}, {"type": "服饰箱包", "value": random.randint(1, 200)}, {"type": "母婴产品", "value": random.randint(1, 200)}, {"type": "其他", "value": random.randint(1, 200)}, ] elif series == "门店": return [ {"type": "家用电器", "value": random.randint(300, 800)}, {"type": "食用酒水", "value": random.randint(300, 800)}, {"type": "个护健康", "value": random.randint(300, 800)}, {"type": "服饰箱包", "value": random.randint(300, 800)}, {"type": "母婴产品", "value": random.randint(300, 800)}, {"type": "其他", "value": random.randint(300, 800)}, ] def flow_conversion_data(series: Literal["当月", "上月"]): """模拟流量转化示例数据切换""" if series == "当月": return [ {"action": "浏览网站", "pv": random.randint(100, 300)}, {"action": "放入购物车", "pv": random.randint(100, 300)}, {"action": "生成订单", "pv": random.randint(100, 300)}, {"action": "支付订单", "pv": random.randint(100, 300)}, {"action": "完成交易", "pv": random.randint(100, 300)}, ] elif series == "上月": return [ {"action": "浏览网站", "pv": random.randint(300, 800)}, {"action": "放入购物车", "pv": random.randint(300, 800)}, {"action": "生成订单", "pv": random.randint(300, 800)}, {"action": "支付订单", "pv": random.randint(300, 800)}, {"action": "完成交易", "pv": random.randint(300, 800)}, ] def content_operation_data(): """模拟生成内容运营示例数据""" return [ {"date": date, "type": _type, "value": random.randint(50, 1000)} for date in ["03-01", "03-02", "03-03", "03-04", "03-05", "03-06", "03-07", "03-08", "03-09", "03-10"] for _type in ["内容生产量", "内容点击量", "内容曝光量", "活跃用户数"] ] def hot_content_data(): """模拟生成热门内容示例数据""" return [{ "title": "示例内容标题xxx", "click": random.randint(100, 10000), "link": {"content": "点击访问", "href": "https://fact.feffery.tech/"}, } for _ in range(random.randint(15, 25))] app = dash.Dash(__name__, suppress_callback_exceptions=True) def layout(): return html.Div( [ # 仪表盘网格布局 fac.AntdRow( [ # 图表卡片示例 fac.AntdCol( simple_chart_card( title="销售额类别占比", description="时间范围:当月", chart=fact.AntdPie( id="sales-pie-chart", data=sales_data(series="全部渠道"), colorField="type", angleField="value", radius=0.8, innerRadius=0.6, label={"type": "spider"}, ), extra=fac.AntdRadioGroup( id="update-sales-pie-chart-data", options=["全部渠道", "线上", "门店"], optionType="button", value="全部渠道", ), height=450, ), span=12, ), fac.AntdCol( simple_chart_card( title="流量转化情况", description=fac.AntdSpace( [ "时间范围:", fac.AntdSelect( id="update-flow-conversion-column-chart-data", options=["当月", "上月"], value="当月", allowClear=False, size="small", variant="filled", ), ], size=0, ), chart=fact.AntdColumn( id="flow-conversion-column-chart", data=flow_conversion_data(series="当月"), xField="action", yField="pv", conversionTag={}, color="#2e8fff", ), height=450, ), span=12, ), fac.AntdCol( simple_chart_card( title="内容运营情况", description="时间范围:近10天", chart=fac.AntdTabs( id="content-operation-tabs", items=[ { "label": series, "key": series, "children": fact.AntdArea( data=content_operation_data(), xField="date", yField="value", seriesField="type", smooth=True, isStack=True, legend={"position": "top"}, ), } for series in ["抖音", "小红书", "快手"] ], tabPosition="left", size="small", destroyInactiveTabPane=True, ), height=500, ), span=16, ), fac.AntdCol( simple_chart_card( title="近期热门内容", description="时间范围:近10天", chart=fac.AntdTable( id="hot-content-table", columns=[ { "title": "标题", "dataIndex": "title", "key": "title", }, { "title": "点击量", "dataIndex": "click", "key": "click", }, { "title": "内容链接", "dataIndex": "link", "key": "link", "renderOptions": { "renderType": "link", }, }, ], data=hot_content_data(), size="small", pagination=False, tableLayout="fixed", maxHeight=325, bordered=True, ), extra=fac.AntdSegmented( id="update-hot-content-table-data", options=[ {"label": series, "value": series} for series in ["抖音", "小红书", "快手"] ], value="抖音", ), height=500, ), span=8, ), # 空白卡片示例 fac.AntdCol( blank_card( fac.AntdCenter( fac.AntdText( [ fac.AntdText("玩转Dash", italic=True), "知识星球出品", ] ) ) ), span=24, ), ], gutter=[18, 18], ), ], style=style( padding=50, background="#f5f5f5", minHeight="100vh", boxSizing="border-box" ), ) app.layout = layout @app.callback( Output("sales-pie-chart", "data"), Input("update-sales-pie-chart-data", "value"), prevent_initial_call=True) def update_sales_pie_chart_data(series): """控制示例销售额饼图的数据系列切换""" return sales_data(series=series) @app.callback( Output("flow-conversion-column-chart", "data"), Input("update-flow-conversion-column-chart-data", "value"), prevent_initial_call=True) def update_flow_conversion_column_chart_data(series): """控制示例流量转化柱状图的数据系列切换""" return flow_conversion_data(series=series) @app.callback( Output("hot-content-table", "data"), Input("update-hot-content-table-data", "value"), running=[[Output("hot-content-table", "loading"), True, False]], prevent_initial_call=True) def update_hot_content_table_data(series): """控制示例热门内容表格的数据系列切换""" time.sleep(0.5) # 模拟计算耗时 return hot_content_data() # 联动更新, 利用上下文去识别当前被激活的选项, 然后对其他需要联动更新的一并进行更新 @app.callback([Output("content-operation-tabs", "activeKey"), Output("update-hot-content-table-data", "value")], [Input("content-operation-tabs", "activeKey"), Input("update-hot-content-table-data", "value")], prevent_initial_call=True, ) def sync_content_series(active_key, value): """控制示例内容运营与热门内容之间的系列同步切换""" if dash.ctx.triggered_id == "content-operation-tabs": return dash.no_update, active_key return value, dash.no_update if __name__ == "__main__": app.run(debug=True)
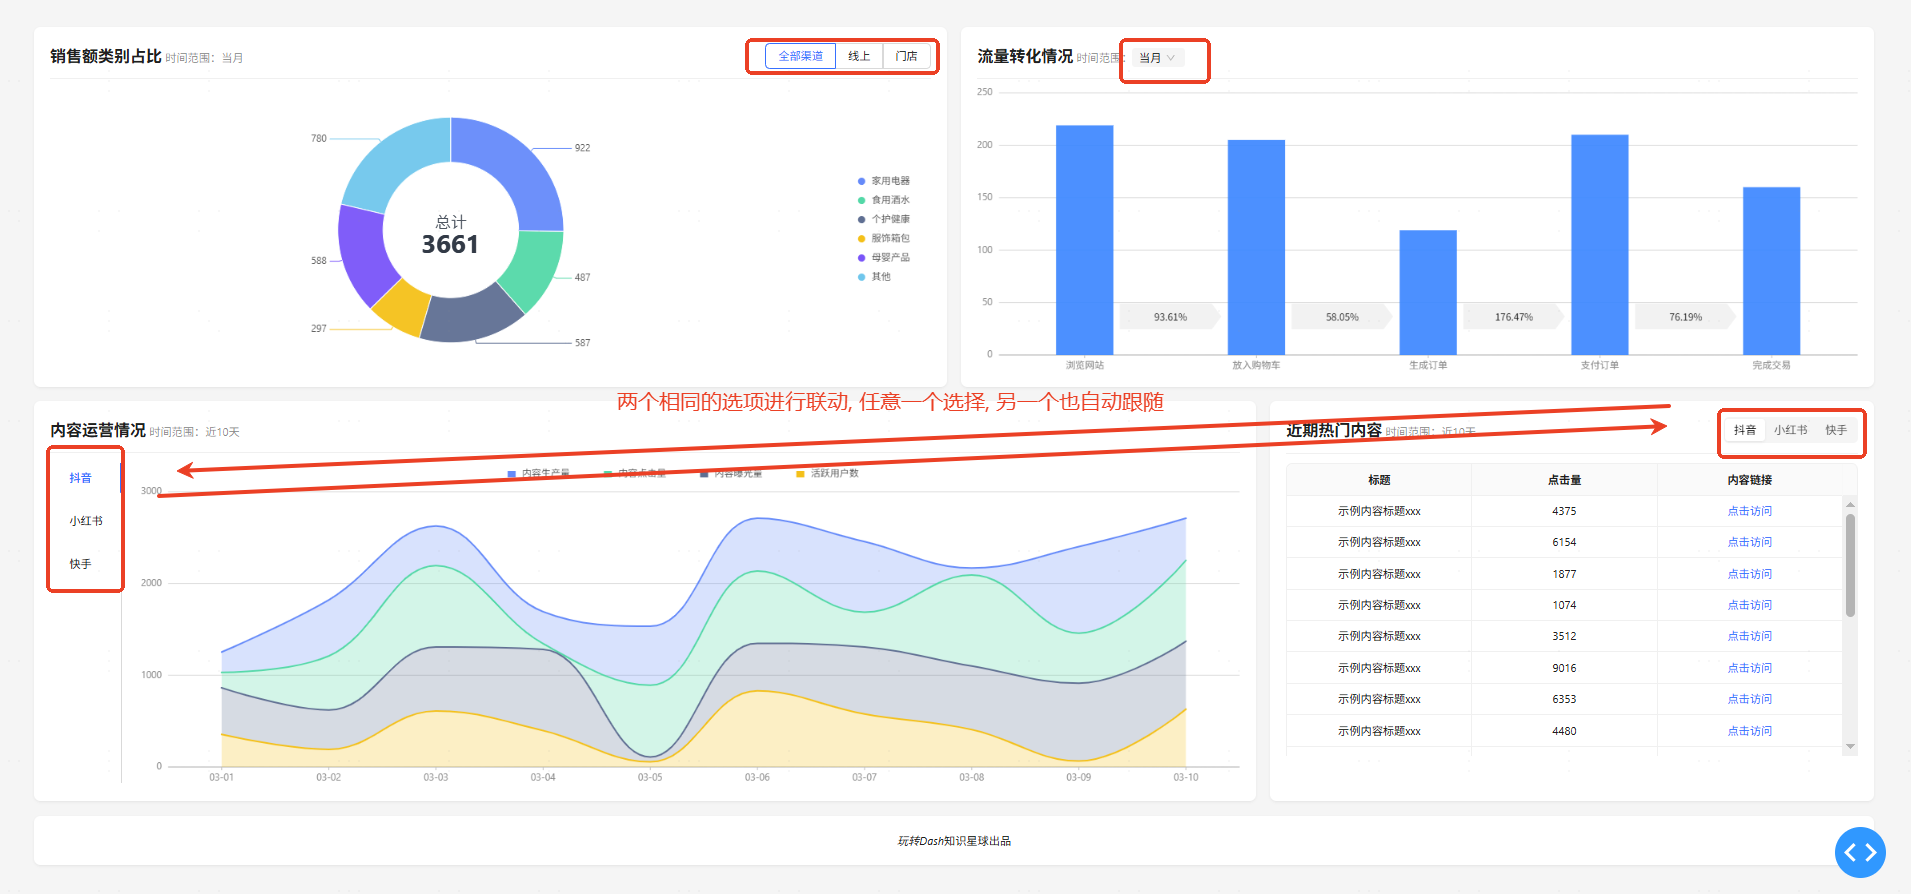
演示效果
带导出功能的仪表盘案例
import io import dash import random import pandas as pd # 注意excel表格导出额外需安装隐式依赖openpyxl import feffery_antd_charts as fact from dash import html, set_props, dcc import feffery_antd_components as fac from dash.dependencies import Input, State from feffery_dash_utils.style_utils import style from feffery_dash_utils.template_utils.dashboard_components import ( welcome_card, blank_card, index_card, simple_chart_card, ) app = dash.Dash(__name__, suppress_callback_exceptions=True) def layout(): return html.Div( [ # 全局统一下载 dcc.Download(id="global-download"), # 消息提示输出目标 fac.Fragment(id="message-target"), # 回到顶部 fac.AntdBackTop(), # 批量下载按钮 fac.AntdFloatButton( id="batch-export-data", shape="square", icon=fac.AntdIcon(icon="antd-download"), tooltip="批量下载数据", style=style(bottom="calc(100vh - 120px)", right=5), ), # 仪表盘网格布局 fac.AntdRow( [ # 欢迎卡片 fac.AntdCol( welcome_card( title="欢迎访问本应用,用户:张三", description=fac.AntdText( [ "您有5个事项待处理,点击", html.A("此处", id="demo-link1"), "查看。", ] ), avatar=fac.AntdAvatar( src="/assets/demo-avatar.png", mode="image", size=72, style=style(background="#1890ff"), ), extra=fac.AntdButton( "更多信息", id="demo-link2", type="link" ), ), span=24, ), # 指标卡片示例 fac.AntdCol( index_card( index_name="总销售额", index_value="¥ 126560", index_description="这是总销售额的指标描述示例内容", extra_content=fac.AntdText( [ "周同比12%", fac.AntdIcon(icon="antd-caret-up", style=style(color="#f5222d")), ",日同比11%", fac.AntdIcon(icon="antd-caret-down", style=style(color="#52c41a")), ] ), footer_content="日销售额 ¥12423", ), span=6, ), fac.AntdCol( index_card( index_name="访问量", index_value=8846, index_description="这是访问量的指标描述示例内容", extra_content=fact.AntdTinyArea( data=[random.randint(50, 100) for _ in range(20)], height=60, smooth=True, ), footer_content="日访问量 1234", ), span=6, ), fac.AntdCol( index_card( index_name="支付笔数", index_value=6560, index_description="这是支付笔数的指标描述示例内容", extra_content=fact.AntdTinyColumn( data=[random.randint(50, 100) for _ in range(20)], height=60, color="#2389ff", columnWidthRatio=0.75, ), footer_content="转化率 60%", ), span=6, ), fac.AntdCol( index_card( index_name="运营活动效果", index_value="78%", index_description="这是运营活动效果的指标描述示例内容", extra_content=fac.AntdCenter( fac.AntdProgress( percent=78, status="active", strokeColor={"from": "#128ee7", "to": "#6cc085"}, ), style=style(height="100%"), ), footer_content=fac.AntdText( [ "周同比8%", fac.AntdIcon(icon="antd-caret-up", style=style(color="#f5222d")), ",日同比3%", fac.AntdIcon(icon="antd-caret-down", style=style(color="#52c41a")), ] ), ), span=6, ), # 图表卡片示例 fac.AntdCol( simple_chart_card( title="销售额类别占比", description="时间范围:当月", chart=fact.AntdPie( id="sales-chart", data=[ {"type": "家用电器", "value": 4544}, {"type": "食用酒水", "value": 3321}, {"type": "个护健康", "value": 3113}, {"type": "服饰箱包", "value": 2341}, {"type": "母婴产品", "value": 1231}, {"type": "其他", "value": 1214} ], colorField="type", angleField="value", radius=0.8, innerRadius=0.6, label={"type": "spider"}, ), extra=fac.AntdTooltip( fac.AntdButton( id="export-sales-data", icon=fac.AntdIcon(icon="antd-download"), type="text", ), title="导出数据", ), height=450, ), span=12, ), fac.AntdCol( simple_chart_card( title="流量转化情况", description="时间范围:当月", chart=fact.AntdColumn( id="flow-conversion-chart", data=[ {"action": "浏览网站", "pv": 50000}, {"action": "放入购物车", "pv": 35000}, {"action": "生成订单", "pv": 25000}, {"action": "支付订单", "pv": 15000}, {"action": "完成交易", "pv": 8500}, ], xField="action", yField="pv", conversionTag={}, color="#2e8fff", ), extra=fac.AntdTooltip( fac.AntdButton( id="export-flow-conversion-data", icon=fac.AntdIcon(icon="antd-download"), type="text", ), title="导出数据", ), height=450, ), span=12, ), fac.AntdCol( simple_chart_card( title="流量转化具体链路", description="时间范围:当月", chart=fact.AntdSankey( data=[ {"source": "首次打开", "target": "首页 UV", "value": 160}, {"source": "结果页", "target": "首页 UV", "value": 40}, {"source": "验证页", "target": "首页 UV", "value": 10}, {"source": "我的", "target": "首页 UV", "value": 10}, {"source": "朋友", "target": "首页 UV", "value": 8}, {"source": "其他来源", "target": "首页 UV", "value": 27}, {"source": "首页 UV", "target": "理财", "value": 30}, {"source": "首页 UV", "target": "扫一扫", "value": 40}, {"source": "首页 UV", "target": "服务", "value": 35}, {"source": "首页 UV", "target": "蚂蚁森林", "value": 25}, {"source": "首页 UV", "target": "跳失", "value": 10, }, {"source": "首页 UV", "target": "借呗", "value": 30}, {"source": "首页 UV", "target": "花呗", "value": 40}, {"source": "首页 UV", "target": "其他流向", "value": 45}, ], sourceField="source", targetField="target", weightField="value", nodeWidthRatio=0.008, nodePaddingRatio=0.03, nodeDraggable=True, ), height=375, ), span=24, ), fac.AntdCol( simple_chart_card( title="内容运营情况", description="时间范围:近10天", chart=fact.AntdArea( data=[ {"date": date, "type": _type, "value": random.randint(50, 1000)} for date in [ "03-01", "03-02", "03-03", "03-04", "03-05", "03-06", "03-07", "03-08", "03-09", "03-10", ] for _type in ["内容生产量", "内容点击量", "内容曝光量", "活跃用户数"] ], xField="date", yField="value", seriesField="type", smooth=True, isStack=True, legend={"position": "top"}, ), height=500, ), span=16, ), fac.AntdCol( simple_chart_card( title="近期热门内容", description="时间范围:近10天", chart=fac.AntdTable( columns=[ {"title": "标题", "dataIndex": "title", "key": "title"}, {"title": "点击量", "dataIndex": "click", "key": "click"}, {"title": "内容链接", "dataIndex": "link", "key": "link", "renderOptions": {"renderType": "link"}}, ], data=[ {"title": "示例内容标题xxx", "click": random.randint(100, 10000), "link": {"content": "点击访问", "href": "https://fact.feffery.tech/"}} for _ in range(18) ], size="small", pagination=False, tableLayout="fixed", maxHeight=325, bordered=True, ), height=500, ), span=8, ), # 空白卡片示例 fac.AntdCol( blank_card( fac.AntdCenter( fac.AntdText([fac.AntdText("玩转Dash", italic=True), "知识星球出品"]) ) ), span=24, ), ], gutter=[18, 18], ), ], style=style( padding=50, background="#f5f5f5", minHeight="100vh", boxSizing="border-box" ), ) app.layout = layout @app.callback([Input("demo-link1", "n_clicks"), Input("demo-link2", "nClicks")]) def link_click_demo(*args): """链接点击交互演示""" set_props( "message-target", {"children": fac.AntdMessage(content="你点击了链接 " + dash.ctx.triggered_id, type="info")}, ) @app.callback(Input("export-sales-data", "nClicks"), State("sales-chart", "data")) def export_sales_data(n_clicks, data): temp_io = io.BytesIO() pd.DataFrame(data).to_excel(temp_io, index=False) set_props("global-download", {"data": dcc.send_bytes(temp_io.getvalue(), "销售额类别占比数据导出.xlsx")}) @app.callback( Input("export-flow-conversion-data", "nClicks"), State("flow-conversion-chart", "data"), ) def export_flow_conversion_data(n_clicks, data): temp_io = io.BytesIO() pd.DataFrame(data).to_excel(temp_io, index=False) set_props("global-download", {"data": dcc.send_bytes(temp_io.getvalue(), "流量转化数据导出.xlsx")}) @app.callback( Input("batch-export-data", "nClicks"), [State("sales-chart", "data"), State("flow-conversion-chart", "data")]) def batch_export_data(n_clicks, sales_data, flow_conversion_data): """控制批量数据导出""" temp_io = io.BytesIO() writer = pd.ExcelWriter(temp_io) # 分别写入不同的工作表 pd.DataFrame(sales_data).to_excel(writer, sheet_name="销售额类别占比数据", index=False) pd.DataFrame(flow_conversion_data).to_excel(writer, sheet_name="流量转化数据", index=False) # 关闭文件 writer.close() set_props("global-download", {"data": dcc.send_bytes(temp_io.getvalue(), "批量数据导出结果.xlsx")}) if __name__ == "__main__": app.run(debug=True)
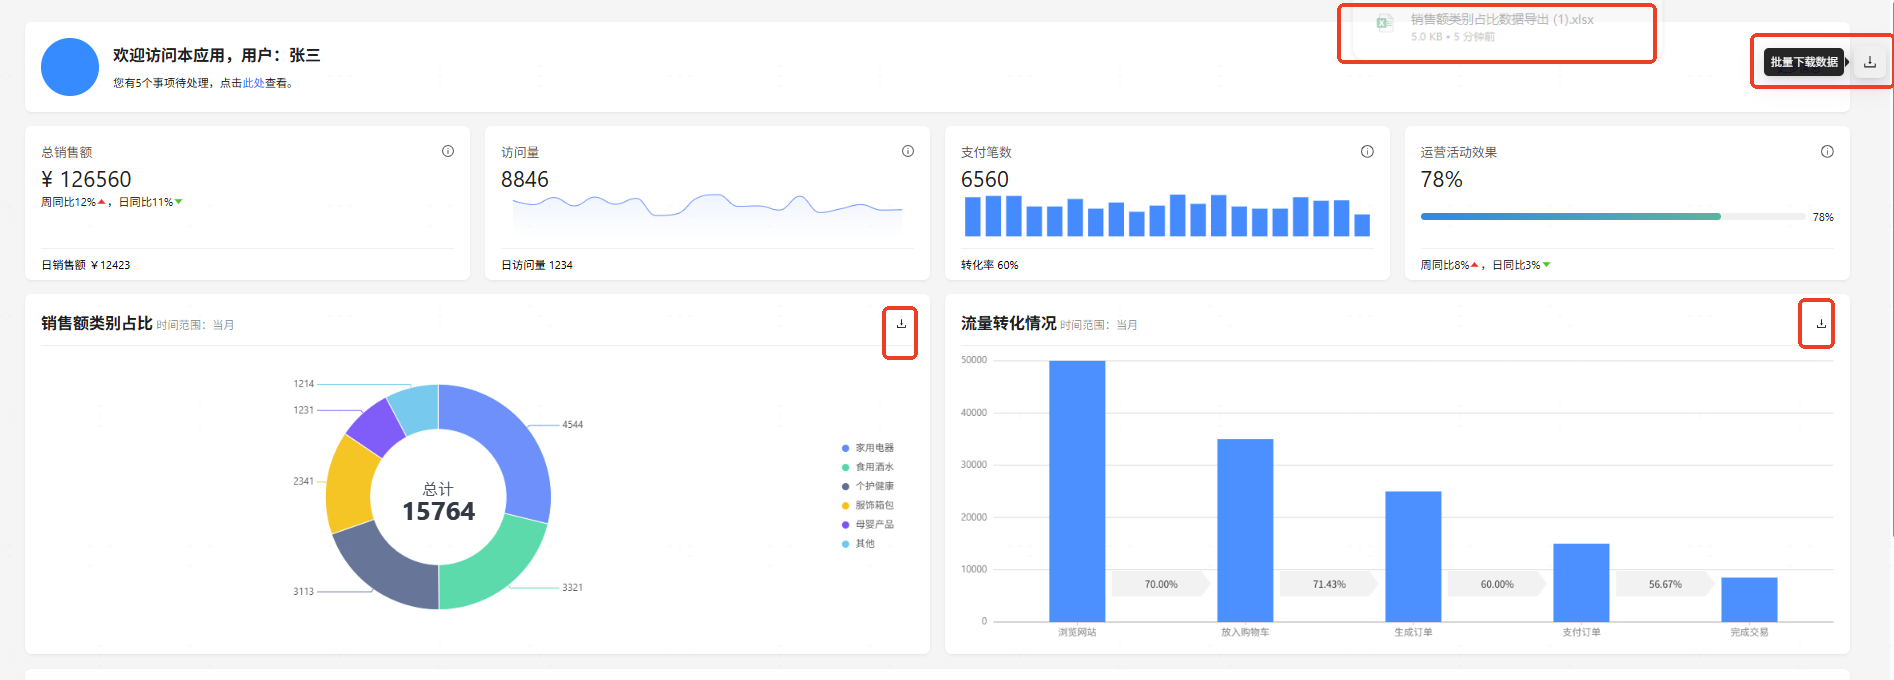
演示效果
批量下载则可以将所有的图标数据写在分别写入多个 sheet 中, 然后在一个表格中导出
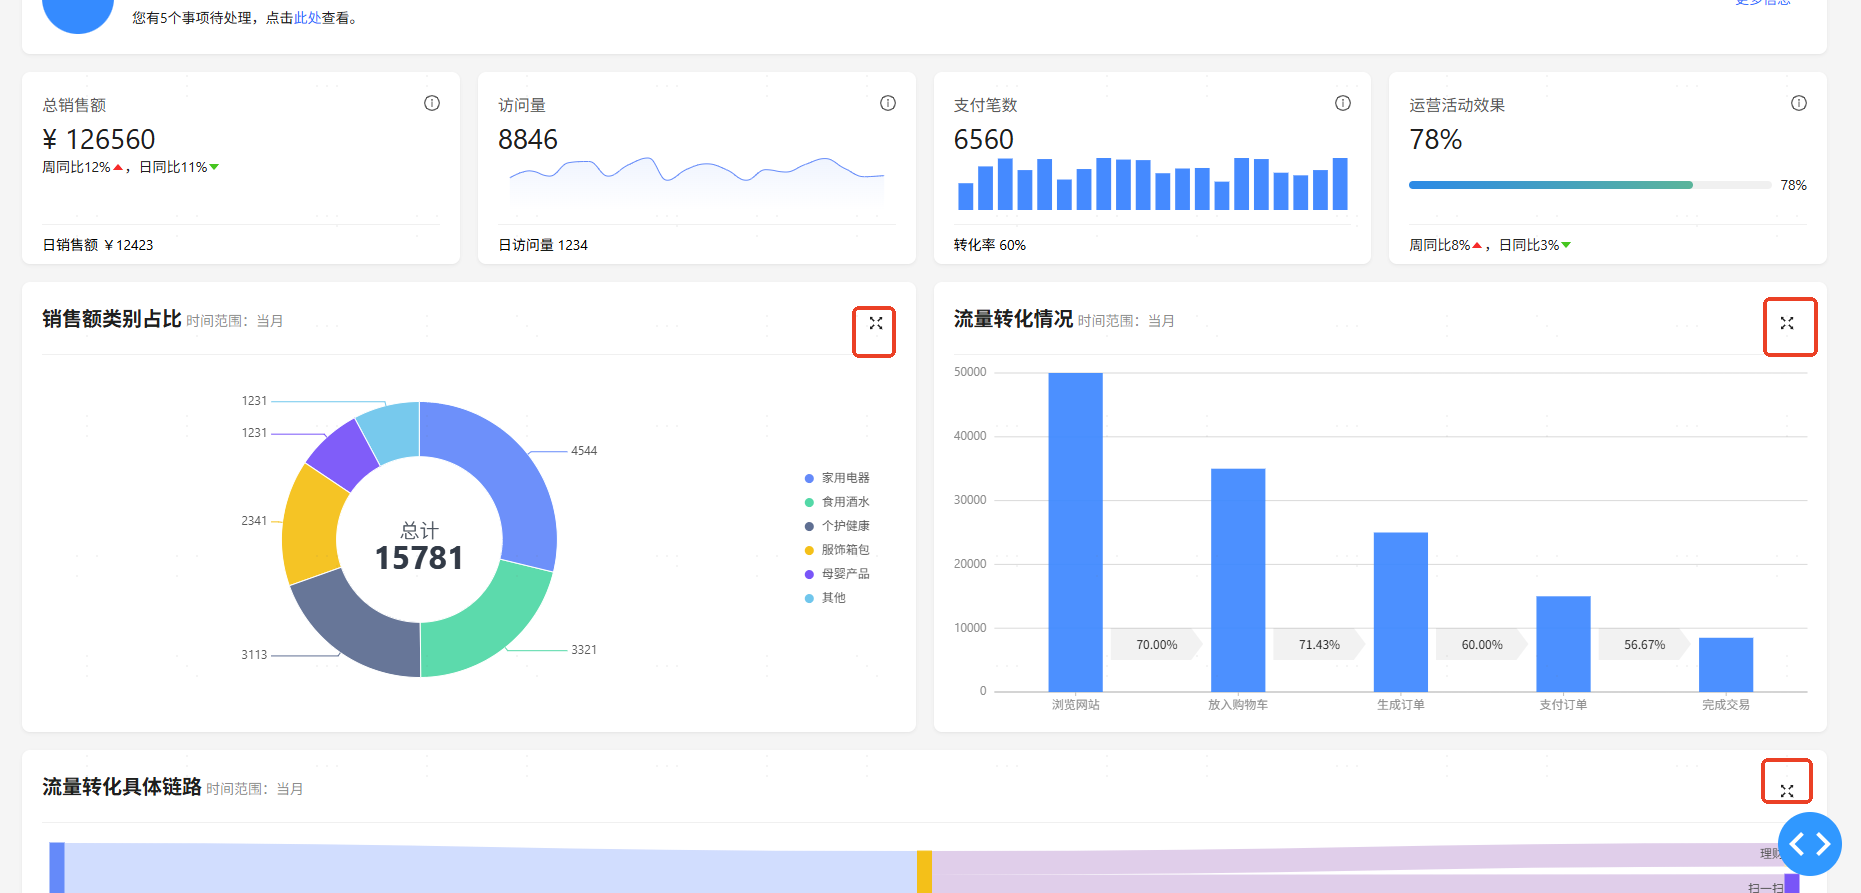
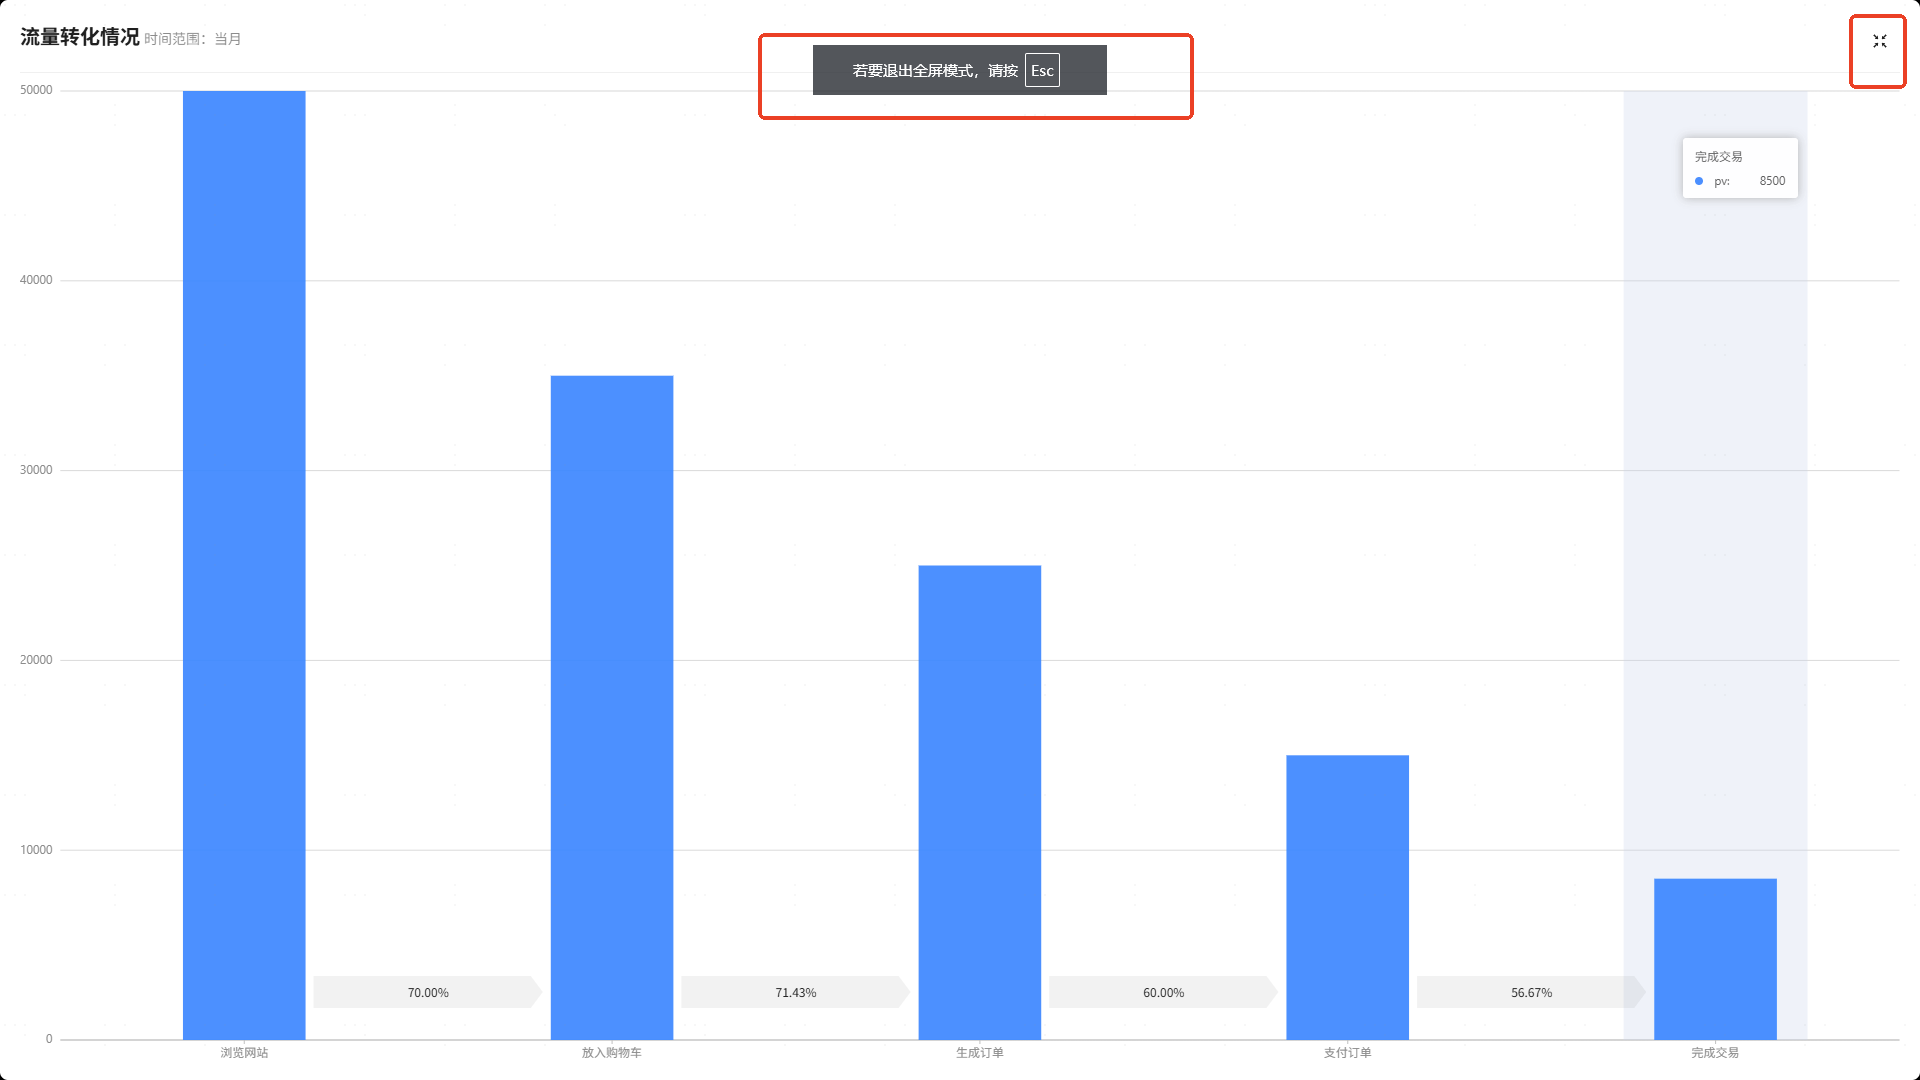
带全屏功能展示功能仪表盘案例
import json import dash import random from dash import html, set_props import feffery_antd_charts as fact import feffery_antd_components as fac import feffery_utils_components as fuc from feffery_dash_utils.style_utils import style from dash.dependencies import Input, Output, State, MATCH from feffery_dash_utils.template_utils.dashboard_components import ( welcome_card, blank_card, index_card, simple_chart_card, ) app = dash.Dash(__name__) def layout(): return html.Div( [ # 消息提示输出目标 fac.Fragment(id="message-target"), # 全局图表全屏化目标控制 fuc.FefferyFullscreen(id="fullscreen-target"), # 仪表盘网格布局 fac.AntdRow( [ # 欢迎卡片 fac.AntdCol( welcome_card( title="欢迎访问本应用,用户:张三", description=fac.AntdText( [ "您有5个事项待处理,点击", html.A("此处", id="demo-link1"), "查看。", ] ), avatar=fac.AntdAvatar( src="/assets/demo-avatar.png", mode="image", size=72, style=style(background="#1890ff"), ), extra=fac.AntdButton( "更多信息", id="demo-link2", type="link" ), ), span=24, ), # 指标卡片示例 fac.AntdCol( index_card( index_name="总销售额", index_value="¥ 126560", index_description="这是总销售额的指标描述示例内容", extra_content=fac.AntdText( [ "周同比12%", fac.AntdIcon( icon="antd-caret-up", style=style(color="#f5222d"), ), ",日同比11%", fac.AntdIcon( icon="antd-caret-down", style=style(color="#52c41a"), ), ] ), footer_content="日销售额 ¥12423", ), span=6, ), fac.AntdCol( index_card( index_name="访问量", index_value=8846, index_description="这是访问量的指标描述示例内容", extra_content=fact.AntdTinyArea( data=[random.randint(50, 100) for _ in range(20)], height=60, smooth=True, ), footer_content="日访问量 1234", ), span=6, ), fac.AntdCol( index_card( index_name="支付笔数", index_value=6560, index_description="这是支付笔数的指标描述示例内容", extra_content=fact.AntdTinyColumn( data=[random.randint(50, 100) for _ in range(20)], height=60, color="#2389ff", columnWidthRatio=0.75, ), footer_content="转化率 60%", ), span=6, ), fac.AntdCol( index_card( index_name="运营活动效果", index_value="78%", index_description="这是运营活动效果的指标描述示例内容", extra_content=fac.AntdCenter( fac.AntdProgress( percent=78, status="active", strokeColor={"from": "#128ee7", "to": "#6cc085"}, ), style=style(height="100%"), ), footer_content=fac.AntdText( [ "周同比8%", fac.AntdIcon( icon="antd-caret-up", style=style(color="#f5222d"), ), ",日同比3%", fac.AntdIcon( icon="antd-caret-down", style=style(color="#52c41a"), ), ] ), ), span=6, ), # 图表卡片示例 fac.AntdCol( simple_chart_card( root_id={"type": "chart-card", "index": "chart-a"}, title="销售额类别占比", description="时间范围:当月", chart=fact.AntdPie( data=[ { "type": "家用电器", "value": 4544, }, { "type": "食用酒水", "value": 3321, }, { "type": "个护健康", "value": 3113, }, { "type": "服饰箱包", "value": 2341, }, { "type": "母婴产品", "value": 1231, }, { "type": "其他", "value": 1231, }, ], colorField="type", angleField="value", radius=0.8, innerRadius=0.6, label={"type": "spider"}, ), extra=fac.AntdButton( id={"type": "chart-card-toggle-fullscreen", "index": "chart-a"}, icon=fac.AntdIcon( id={"type": "chart-card-toggle-fullscreen-icon", "index": "chart-a"}, icon="antd-full-screen", ), type="text", size="large", ), height=450, ), span=12, ), fac.AntdCol( simple_chart_card( root_id={"type": "chart-card", "index": "chart-b"}, title="流量转化情况", description="时间范围:当月", chart=fact.AntdColumn( data=[ { "action": "浏览网站", "pv": 50000, }, { "action": "放入购物车", "pv": 35000, }, { "action": "生成订单", "pv": 25000, }, { "action": "支付订单", "pv": 15000, }, { "action": "完成交易", "pv": 8500, }, ], xField="action", yField="pv", conversionTag={}, color="#2e8fff", autoFit=True, ), extra=fac.AntdButton( id={"type": "chart-card-toggle-fullscreen", "index": "chart-b"}, icon=fac.AntdIcon( id={"type": "chart-card-toggle-fullscreen-icon", "index": "chart-b"}, icon="antd-full-screen", ), type="text", size="large", ), height=450, ), span=12, ), fac.AntdCol( simple_chart_card( root_id={"type": "chart-card", "index": "chart-c"}, title="流量转化具体链路", description="时间范围:当月", chart=fact.AntdSankey( data=[ { "source": "首次打开", "target": "首页 UV", "value": 160, }, { "source": "结果页", "target": "首页 UV", "value": 40, }, { "source": "验证页", "target": "首页 UV", "value": 10, }, { "source": "我的", "target": "首页 UV", "value": 10, }, {"source": "朋友", "target": "首页 UV", "value": 8}, { "source": "其他来源", "target": "首页 UV", "value": 27, }, { "source": "首页 UV", "target": "理财", "value": 30, }, { "source": "首页 UV", "target": "扫一扫", "value": 40, }, { "source": "首页 UV", "target": "服务", "value": 35, }, { "source": "首页 UV", "target": "蚂蚁森林", "value": 25, }, { "source": "首页 UV", "target": "跳失", "value": 10, }, { "source": "首页 UV", "target": "借呗", "value": 30, }, { "source": "首页 UV", "target": "花呗", "value": 40, }, { "source": "首页 UV", "target": "其他流向", "value": 45, }, ], sourceField="source", targetField="target", weightField="value", nodeWidthRatio=0.008, nodePaddingRatio=0.03, nodeDraggable=True, ), extra=fac.AntdButton( id={"type": "chart-card-toggle-fullscreen", "index": "chart-c"}, icon=fac.AntdIcon( id={"type": "chart-card-toggle-fullscreen-icon", "index": "chart-c"}, icon="antd-full-screen", ), type="text", size="large", ), height=375, ), span=24, ), fac.AntdCol( simple_chart_card( root_id={"type": "chart-card", "index": "chart-d"}, title="内容运营情况", description="时间范围:近10天", chart=fact.AntdArea( data=[ { "date": date, "type": type, "value": random.randint(50, 1000), } for date in [ "03-01", "03-02", "03-03", "03-04", "03-05", "03-06", "03-07", "03-08", "03-09", "03-10", ] for type in [ "内容生产量", "内容点击量", "内容曝光量", "活跃用户数", ] ], xField="date", yField="value", seriesField="type", smooth=True, isStack=True, legend={"position": "top"}, ), extra=fac.AntdButton( id={"type": "chart-card-toggle-fullscreen", "index": "chart-d"}, icon=fac.AntdIcon( id={"type": "chart-card-toggle-fullscreen-icon", "index": "chart-d"}, icon="antd-full-screen", ), type="text", size="large", ), height=500, ), span=16, ), fac.AntdCol( simple_chart_card( root_id={"type": "chart-card", "index": "chart-e"}, title="近期热门内容", description="时间范围:近10天", chart=fac.AntdTable( columns=[ { "title": "标题", "dataIndex": "title", "key": "title", }, { "title": "点击量", "dataIndex": "click", "key": "click", }, { "title": "内容链接", "dataIndex": "link", "key": "link", "renderOptions": { "renderType": "link", }, }, ], data=[ { "title": "示例内容标题xxx", "click": random.randint(100, 10000), "link": { "content": "点击访问", "href": "https://fact.feffery.tech/", }, } for i in range(18) ], size="small", pagination=False, tableLayout="fixed", maxHeight=325, bordered=True, ), extra=fac.AntdButton( id={"type": "chart-card-toggle-fullscreen", "index": "chart-e"}, icon=fac.AntdIcon( id={"type": "chart-card-toggle-fullscreen-icon", "index": "chart-e"}, icon="antd-full-screen", ), type="text", size="large", ), height=500, ), span=8, ), # 空白卡片示例 fac.AntdCol( blank_card( fac.AntdCenter( fac.AntdText( [ fac.AntdText("玩转Dash", italic=True), "知识星球出品", ] ) ) ), span=24, ), ], gutter=[18, 18], ), ], style=style( padding=50, background="#f5f5f5", minHeight="100vh", boxSizing="border-box" ), ) app.layout = layout @app.callback([Input("demo-link1", "n_clicks"), Input("demo-link2", "nClicks")]) def link_click_demo(*args): """链接点击交互演示""" set_props( "message-target", {"children": fac.AntdMessage(content="你点击了链接 " + dash.ctx.triggered_id, type="info")}, ) @app.callback( Output({"type": "chart-card-toggle-fullscreen-icon", "index": MATCH}, "icon"), Input({"type": "chart-card-toggle-fullscreen", "index": MATCH}, "nClicks"), State({"type": "chart-card-toggle-fullscreen-icon", "index": MATCH}, "icon"), prevent_initial_call=True, ) def toggle_full_screen(n_clicks, icon): """控制任意图表卡片的全屏化切换""" # 获取本次回调触发来源id target_id = dash.ctx.triggered_id target_id["type"] = "chart-card" if icon == "antd-full-screen": # 切换下一个状态的按钮图标 next_icon = "antd-full-screen-exit" # 切换下一个状态的全屏化控制相关参数 is_full_screen = True else: # 切换下一个状态的按钮图标 next_icon = "antd-full-screen" # 切换下一个状态的全屏化控制相关参数 is_full_screen = False # 借助set_props()突破MATCH模式默认回调角色编排限制 set_props("fullscreen-target", { "targetId": json.dumps(target_id, separators=(",", ":")), "isFullscreen": is_full_screen, }) return next_icon if __name__ == "__main__": app.run(debug=True)
演示效果
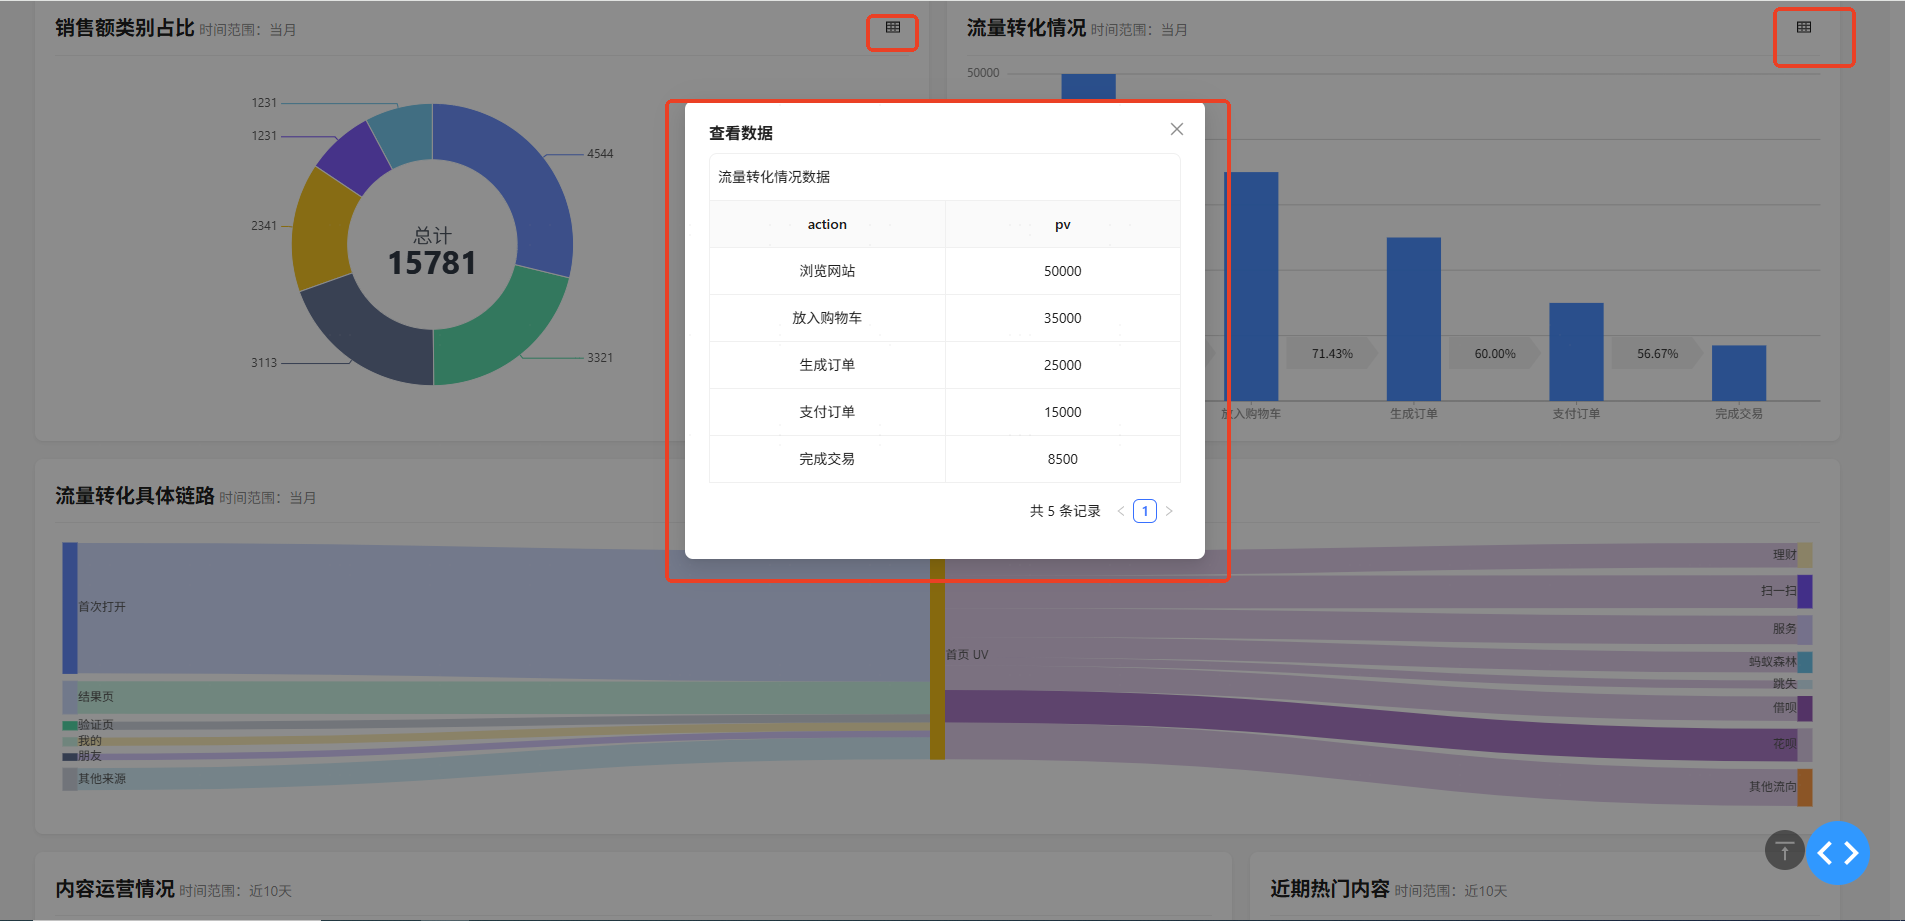
带图表数据查看功能仪表盘示例
import dash import random from dash import html, set_props import feffery_antd_charts as fact import feffery_antd_components as fac from dash.dependencies import Input, State from feffery_dash_utils.style_utils import style from feffery_dash_utils.template_utils.dashboard_components import ( welcome_card, blank_card, index_card, simple_chart_card, ) app = dash.Dash(__name__, suppress_callback_exceptions=True) def layout(): return html.Div( [ # 消息提示输出目标 fac.Fragment(id="message-target"), # 回到顶部 fac.AntdBackTop(), # 统一数据查看模态框 fac.AntdModal(id="view-data-modal", title="查看数据"), # 仪表盘网格布局 fac.AntdRow( [ # 欢迎卡片 fac.AntdCol( welcome_card( title="欢迎访问本应用,用户:张三", description=fac.AntdText( [ "您有5个事项待处理,点击", html.A("此处", id="demo-link1"), "查看。", ] ), avatar=fac.AntdAvatar( src="/assets/demo-avatar.png", mode="image", size=72, style=style(background="#1890ff"), ), extra=fac.AntdButton( "更多信息", id="demo-link2", type="link" ), ), span=24, ), # 指标卡片示例 fac.AntdCol( index_card( index_name="总销售额", index_value="¥ 126560", index_description="这是总销售额的指标描述示例内容", extra_content=fac.AntdText( [ "周同比12%", fac.AntdIcon( icon="antd-caret-up", style=style(color="#f5222d"), ), ",日同比11%", fac.AntdIcon( icon="antd-caret-down", style=style(color="#52c41a"), ), ] ), footer_content="日销售额 ¥12423", ), span=6, ), fac.AntdCol( index_card( index_name="访问量", index_value=8846, index_description="这是访问量的指标描述示例内容", extra_content=fact.AntdTinyArea( data=[random.randint(50, 100) for _ in range(20)], height=60, smooth=True, ), footer_content="日访问量 1234", ), span=6, ), fac.AntdCol( index_card( index_name="支付笔数", index_value=6560, index_description="这是支付笔数的指标描述示例内容", extra_content=fact.AntdTinyColumn( data=[random.randint(50, 100) for _ in range(20)], height=60, color="#2389ff", columnWidthRatio=0.75, ), footer_content="转化率 60%", ), span=6, ), fac.AntdCol( index_card( index_name="运营活动效果", index_value="78%", index_description="这是运营活动效果的指标描述示例内容", extra_content=fac.AntdCenter( fac.AntdProgress( percent=78, status="active", strokeColor={"from": "#128ee7", "to": "#6cc085"}, ), style=style(height="100%"), ), footer_content=fac.AntdText( [ "周同比8%", fac.AntdIcon( icon="antd-caret-up", style=style(color="#f5222d"), ), ",日同比3%", fac.AntdIcon( icon="antd-caret-down", style=style(color="#52c41a"), ), ] ), ), span=6, ), # 图表卡片示例 fac.AntdCol( simple_chart_card( title="销售额类别占比", description="时间范围:当月", chart=fact.AntdPie( id="sales-chart", data=[ { "type": "家用电器", "value": 4544, }, { "type": "食用酒水", "value": 3321, }, { "type": "个护健康", "value": 3113, }, { "type": "服饰箱包", "value": 2341, }, { "type": "母婴产品", "value": 1231, }, { "type": "其他", "value": 1231, }, ], colorField="type", angleField="value", radius=0.8, innerRadius=0.6, label={"type": "spider"}, ), extra=fac.AntdTooltip( fac.AntdButton( id="view-sales-data", icon=fac.AntdIcon(icon="antd-table"), type="text", ), title="查看数据", ), height=450, ), span=12, ), fac.AntdCol( simple_chart_card( title="流量转化情况", description="时间范围:当月", chart=fact.AntdColumn( id="flow-conversion-chart", data=[ { "action": "浏览网站", "pv": 50000, }, { "action": "放入购物车", "pv": 35000, }, { "action": "生成订单", "pv": 25000, }, { "action": "支付订单", "pv": 15000, }, { "action": "完成交易", "pv": 8500, }, ], xField="action", yField="pv", conversionTag={}, color="#2e8fff", ), extra=fac.AntdTooltip( fac.AntdButton( id="view-flow-conversion-data", icon=fac.AntdIcon(icon="antd-table"), type="text", ), title="查看数据", ), height=450, ), span=12, ), fac.AntdCol( simple_chart_card( title="流量转化具体链路", description="时间范围:当月", chart=fact.AntdSankey( data=[ { "source": "首次打开", "target": "首页 UV", "value": 160, }, { "source": "结果页", "target": "首页 UV", "value": 40, }, { "source": "验证页", "target": "首页 UV", "value": 10, }, { "source": "我的", "target": "首页 UV", "value": 10, }, {"source": "朋友", "target": "首页 UV", "value": 8}, { "source": "其他来源", "target": "首页 UV", "value": 27, }, { "source": "首页 UV", "target": "理财", "value": 30, }, { "source": "首页 UV", "target": "扫一扫", "value": 40, }, { "source": "首页 UV", "target": "服务", "value": 35, }, { "source": "首页 UV", "target": "蚂蚁森林", "value": 25, }, { "source": "首页 UV", "target": "跳失", "value": 10, }, { "source": "首页 UV", "target": "借呗", "value": 30, }, { "source": "首页 UV", "target": "花呗", "value": 40, }, { "source": "首页 UV", "target": "其他流向", "value": 45, }, ], sourceField="source", targetField="target", weightField="value", nodeWidthRatio=0.008, nodePaddingRatio=0.03, nodeDraggable=True, ), height=375, ), span=24, ), fac.AntdCol( simple_chart_card( title="内容运营情况", description="时间范围:近10天", chart=fact.AntdArea( data=[ { "date": date, "type": type, "value": random.randint(50, 1000), } for date in [ "03-01", "03-02", "03-03", "03-04", "03-05", "03-06", "03-07", "03-08", "03-09", "03-10", ] for type in [ "内容生产量", "内容点击量", "内容曝光量", "活跃用户数", ] ], xField="date", yField="value", seriesField="type", smooth=True, isStack=True, legend={"position": "top"}, ), height=500, ), span=16, ), fac.AntdCol( simple_chart_card( title="近期热门内容", description="时间范围:近10天", chart=fac.AntdTable( columns=[ { "title": "标题", "dataIndex": "title", "key": "title", }, { "title": "点击量", "dataIndex": "click", "key": "click", }, { "title": "内容链接", "dataIndex": "link", "key": "link", "renderOptions": { "renderType": "link", }, }, ], data=[ { "title": "示例内容标题xxx", "click": random.randint(100, 10000), "link": { "content": "点击访问", "href": "https://fact.feffery.tech/", }, } for i in range(18) ], size="small", pagination=False, tableLayout="fixed", maxHeight=325, bordered=True, ), height=500, ), span=8, ), # 空白卡片示例 fac.AntdCol( blank_card( fac.AntdCenter( fac.AntdText( [ fac.AntdText("玩转Dash", italic=True), "知识星球出品", ] ) ) ), span=24, ), ], gutter=[18, 18], ), ], style=style( padding=50, background="#f5f5f5", minHeight="100vh", boxSizing="border-box" ), ) app.layout = layout @app.callback([Input("demo-link1", "n_clicks"), Input("demo-link2", "nClicks")]) def link_click_demo(*args): """链接点击交互演示""" set_props( "message-target", { "children": fac.AntdMessage( content="你点击了链接 " + dash.ctx.triggered_id, type="info" ) }, ) @app.callback(Input("view-sales-data", "nClicks"), State("sales-chart", "data")) def view_sales_data(nClicks, data): set_props( "view-data-modal", { "visible": True, "children": fac.AntdTable( title="销售额类别占比数据", columns=[ {"dataIndex": "type", "title": "type"}, {"dataIndex": "value", "title": "value"}, ], data=data, tableLayout="fixed", bordered=True, sortOptions={"sortDataIndexes": ["value"]}, ), }, ) @app.callback( Input("view-flow-conversion-data", "nClicks"), State("flow-conversion-chart", "data"), ) def view_flow_conversion_data(nClicks, data): set_props( "view-data-modal", { "visible": True, "children": fac.AntdTable( title="流量转化情况数据", columns=[ {"dataIndex": "action", "title": "action"}, {"dataIndex": "pv", "title": "pv"}, ], data=data, tableLayout="fixed", bordered=True, ), }, ) if __name__ == "__main__": app.run(debug=True)
演示效果
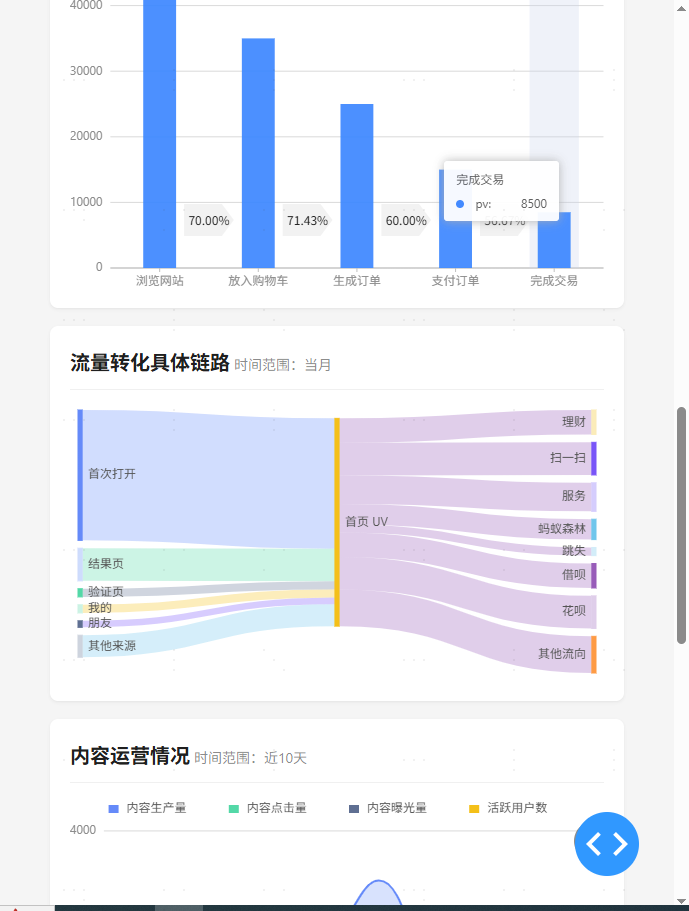
多端自动适配
import dash import random from dash import html, set_props import feffery_antd_charts as fact from dash.dependencies import Input import feffery_antd_components as fac from feffery_dash_utils.style_utils import style from feffery_dash_utils.template_utils.dashboard_components import ( blank_card, index_card, simple_chart_card, ) app = dash.Dash(__name__, suppress_callback_exceptions=True) def layout(): return html.Div( [ # 消息提示输出目标 fac.Fragment(id="message-target"), # 回到顶部 fac.AntdBackTop(), # 仪表盘网格布局 fac.AntdRow( [ # 指标卡片示例 fac.AntdCol( index_card( index_name="总销售额", index_value="¥ 126560", index_description="这是总销售额的指标描述示例内容", extra_content=fac.AntdText( [ "周同比12%", fac.AntdIcon( icon="antd-caret-up", style=style(color="#f5222d"), ), ",日同比11%", fac.AntdIcon( icon="antd-caret-down", style=style(color="#52c41a"), ), ] ), footer_content="日销售额 ¥12423", ), xs=24, sm=24, md=12, xl=6, ), fac.AntdCol( index_card( index_name="访问量", index_value=8846, index_description="这是访问量的指标描述示例内容", extra_content=fact.AntdTinyArea( data=[random.randint(50, 100) for _ in range(20)], height=60, smooth=True, ), footer_content="日访问量 1234", ), xs=24, sm=24, md=12, xl=6, ), fac.AntdCol( index_card( index_name="支付笔数", index_value=6560, index_description="这是支付笔数的指标描述示例内容", extra_content=fact.AntdTinyColumn( data=[random.randint(50, 100) for _ in range(20)], height=60, color="#2389ff", columnWidthRatio=0.75, ), footer_content="转化率 60%", ), xs=24, sm=24, md=12, xl=6, ), fac.AntdCol( index_card( index_name="运营活动效果", index_value="78%", index_description="这是运营活动效果的指标描述示例内容", extra_content=fac.AntdCenter( fac.AntdProgress( percent=78, status="active", strokeColor={"from": "#128ee7", "to": "#6cc085"}, ), style=style(height="100%"), ), footer_content=fac.AntdText( [ "周同比8%", fac.AntdIcon( icon="antd-caret-up", style=style(color="#f5222d"), ), ",日同比3%", fac.AntdIcon( icon="antd-caret-down", style=style(color="#52c41a"), ), ] ), ), xs=24, sm=24, md=12, xl=6, ), # 图表卡片示例 fac.AntdCol( simple_chart_card( title="销售额类别占比", description="时间范围:当月", chart=fact.AntdPie( data=[ { "type": "家用电器", "value": 4544, }, { "type": "食用酒水", "value": 3321, }, { "type": "个护健康", "value": 3113, }, { "type": "服饰箱包", "value": 2341, }, { "type": "母婴产品", "value": 1231, }, { "type": "其他", "value": 1231, }, ], colorField="type", angleField="value", radius=0.8, innerRadius=0.6, label={"type": "spider"}, ), height=450, ), xs=24, sm=24, md=24, lg=24, xl=12, ), fac.AntdCol( simple_chart_card( title="流量转化情况", description="时间范围:当月", chart=fact.AntdColumn( data=[ { "action": "浏览网站", "pv": 50000, }, { "action": "放入购物车", "pv": 35000, }, { "action": "生成订单", "pv": 25000, }, { "action": "支付订单", "pv": 15000, }, { "action": "完成交易", "pv": 8500, }, ], xField="action", yField="pv", conversionTag={}, color="#2e8fff", ), height=450, ), xs=24, sm=24, md=24, lg=24, xl=12, ), fac.AntdCol( simple_chart_card( title="流量转化具体链路", description="时间范围:当月", chart=fact.AntdSankey( data=[ { "source": "首次打开", "target": "首页 UV", "value": 160, }, { "source": "结果页", "target": "首页 UV", "value": 40, }, { "source": "验证页", "target": "首页 UV", "value": 10, }, { "source": "我的", "target": "首页 UV", "value": 10, }, {"source": "朋友", "target": "首页 UV", "value": 8}, { "source": "其他来源", "target": "首页 UV", "value": 27, }, { "source": "首页 UV", "target": "理财", "value": 30, }, { "source": "首页 UV", "target": "扫一扫", "value": 40, }, { "source": "首页 UV", "target": "服务", "value": 35, }, { "source": "首页 UV", "target": "蚂蚁森林", "value": 25, }, { "source": "首页 UV", "target": "跳失", "value": 10, }, { "source": "首页 UV", "target": "借呗", "value": 30, }, { "source": "首页 UV", "target": "花呗", "value": 40, }, { "source": "首页 UV", "target": "其他流向", "value": 45, }, ], sourceField="source", targetField="target", weightField="value", nodeWidthRatio=0.008, nodePaddingRatio=0.03, nodeDraggable=True, ), height=375, ), span=24, ), fac.AntdCol( simple_chart_card( title="内容运营情况", description="时间范围:近10天", chart=fact.AntdArea( data=[ { "date": date, "type": type, "value": random.randint(50, 1000), } for date in [ "03-01", "03-02", "03-03", "03-04", "03-05", "03-06", "03-07", "03-08", "03-09", "03-10", ] for type in [ "内容生产量", "内容点击量", "内容曝光量", "活跃用户数", ] ], xField="date", yField="value", seriesField="type", smooth=True, isStack=True, legend={"position": "top"}, ), height=500, ), xs=24, sm=24, md=24, lg=24, xl=16, ), fac.AntdCol( simple_chart_card( title="近期热门内容", description="时间范围:近10天", chart=fac.AntdTable( columns=[ { "title": "标题", "dataIndex": "title", "key": "title", }, { "title": "点击量", "dataIndex": "click", "key": "click", }, { "title": "内容链接", "dataIndex": "link", "key": "link", "renderOptions": { "renderType": "link", }, }, ], data=[ { "title": "示例内容标题xxx", "click": random.randint(100, 10000), "link": { "content": "点击访问", "href": "https://fact.feffery.tech/", }, } for i in range(18) ], size="small", pagination=False, tableLayout="fixed", maxHeight=325, bordered=True, ), height=500, ), xs=24, sm=24, md=24, lg=24, xl=8, ), # 空白卡片示例 fac.AntdCol( blank_card( fac.AntdCenter( fac.AntdText( [ fac.AntdText("玩转Dash", italic=True), "知识星球出品", ] ) ) ), span=24, ), ], gutter=[18, 18], ), ], style=style( padding=50, background="#f5f5f5", minHeight="100vh", boxSizing="border-box" ), ) app.layout = layout @app.callback([Input("demo-link1", "n_clicks"), Input("demo-link2", "nClicks")]) def link_click_demo(*args): """链接点击交互演示""" set_props( "message-target", {"children": fac.AntdMessage(content="你点击了链接 " + dash.ctx.triggered_id, type="info")}, ) if __name__ == "__main__": app.run(debug=True)
演示效果
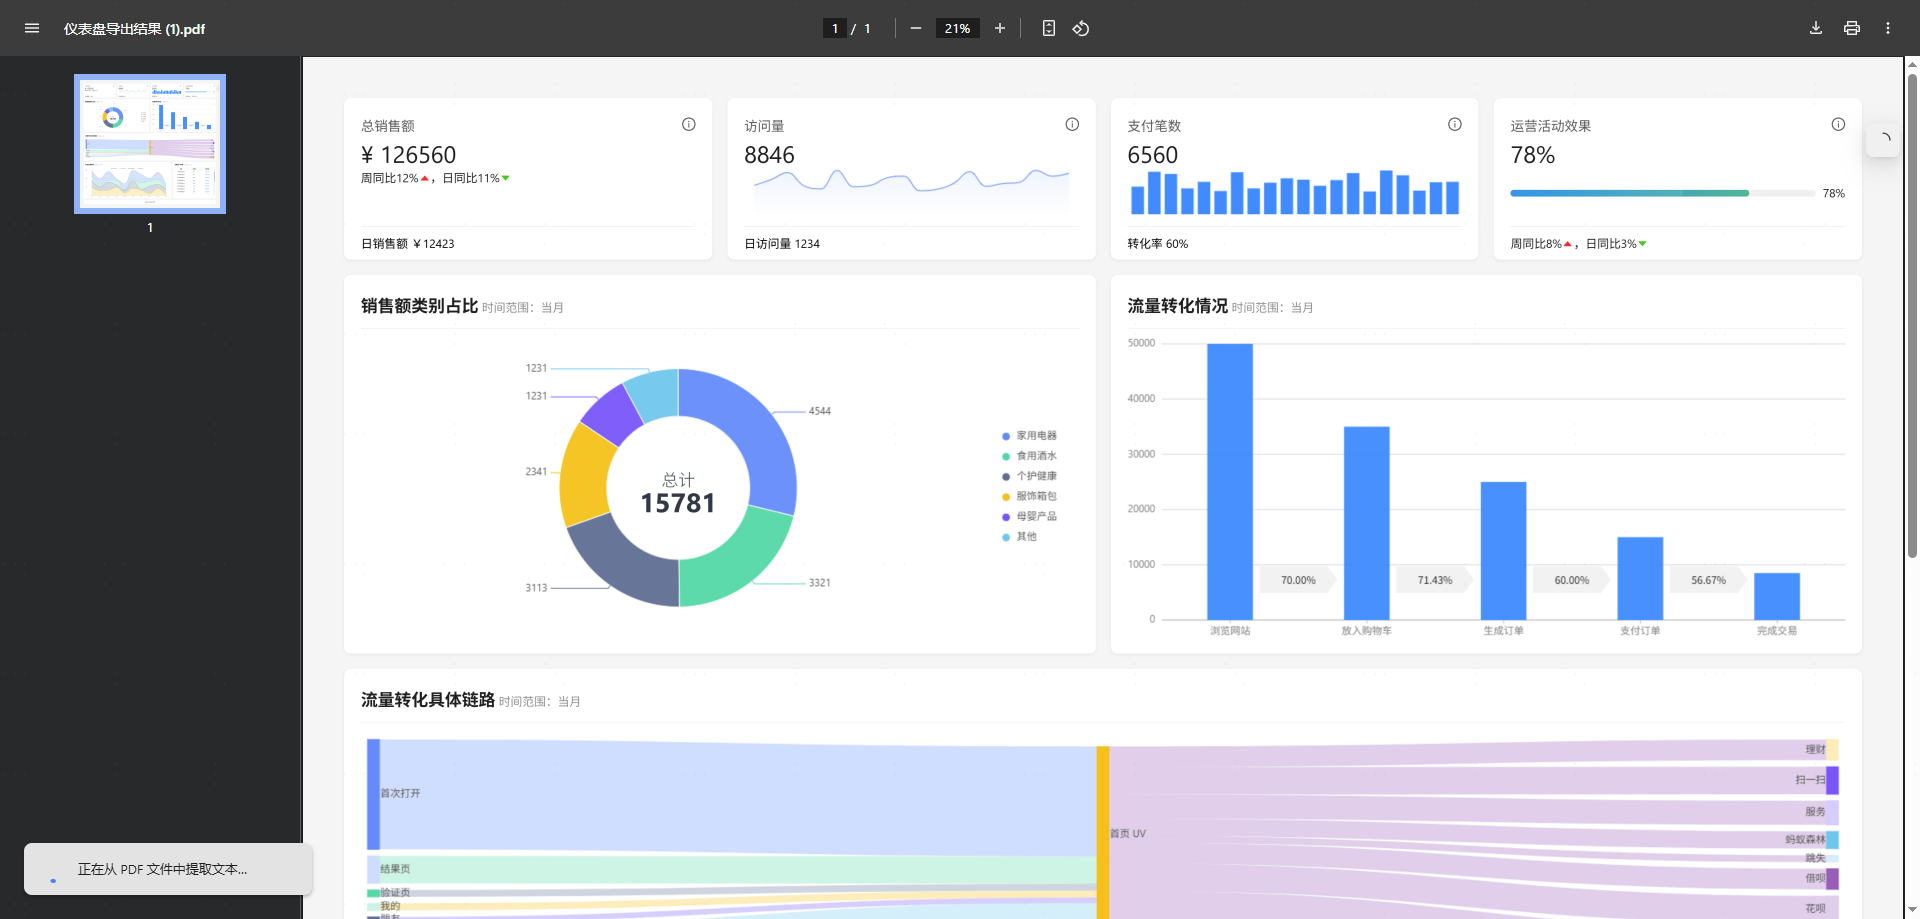
仪表盘导出为报告文件
import os import io import uuid import dash import random import base64 from fpdf import FPDF from PIL import Image import feffery_antd_charts as fact from dash import html, set_props, dcc import feffery_antd_components as fac import feffery_utils_components as fuc from dash.dependencies import Input, Output from feffery_dash_utils.style_utils import style from feffery_dash_utils.template_utils.dashboard_components import ( blank_card, index_card, simple_chart_card, ) app = dash.Dash(__name__, suppress_callback_exceptions=True) def layout(): return html.Div( [ # 全局统一下载 dcc.Download(id="global-download"), # 消息提示输出目标 fac.Fragment(id="message-target"), # 回到顶部 fac.AntdBackTop(), # 批量下载按钮 fac.AntdFloatButton( id="export-pdf", shape="square", icon=fac.AntdIcon(icon="antd-cloud-download"), tooltip="导出仪表盘为pdf", style=style(bottom="calc(100vh - 120px)", right=5), ), fuc.FefferyDom2Image(id="export-dashboard-to-image", scale=3), # 仪表盘网格布局 fac.AntdRow( [ # 指标卡片示例 fac.AntdCol( index_card( index_name="总销售额", index_value="¥ 126560", index_description="这是总销售额的指标描述示例内容", extra_content=fac.AntdText( [ "周同比12%", fac.AntdIcon( icon="antd-caret-up", style=style(color="#f5222d"), ), ",日同比11%", fac.AntdIcon( icon="antd-caret-down", style=style(color="#52c41a"), ), ] ), footer_content="日销售额 ¥12423", ), span=6, ), fac.AntdCol( index_card( index_name="访问量", index_value=8846, index_description="这是访问量的指标描述示例内容", extra_content=fact.AntdTinyArea( data=[random.randint(50, 100) for _ in range(20)], height=60, smooth=True, ), footer_content="日访问量 1234", ), span=6, ), fac.AntdCol( index_card( index_name="支付笔数", index_value=6560, index_description="这是支付笔数的指标描述示例内容", extra_content=fact.AntdTinyColumn( data=[random.randint(50, 100) for _ in range(20)], height=60, color="#2389ff", columnWidthRatio=0.75, ), footer_content="转化率 60%", ), span=6, ), fac.AntdCol( index_card( index_name="运营活动效果", index_value="78%", index_description="这是运营活动效果的指标描述示例内容", extra_content=fac.AntdCenter( fac.AntdProgress( percent=78, status="active", strokeColor={"from": "#128ee7", "to": "#6cc085"}, ), style=style(height="100%"), ), footer_content=fac.AntdText( [ "周同比8%", fac.AntdIcon( icon="antd-caret-up", style=style(color="#f5222d"), ), ",日同比3%", fac.AntdIcon( icon="antd-caret-down", style=style(color="#52c41a"), ), ] ), ), span=6, ), # 图表卡片示例 fac.AntdCol( simple_chart_card( title="销售额类别占比", description="时间范围:当月", chart=fact.AntdPie( data=[ { "type": "家用电器", "value": 4544, }, { "type": "食用酒水", "value": 3321, }, { "type": "个护健康", "value": 3113, }, { "type": "服饰箱包", "value": 2341, }, { "type": "母婴产品", "value": 1231, }, { "type": "其他", "value": 1231, }, ], colorField="type", angleField="value", radius=0.8, innerRadius=0.6, label={"type": "spider"}, ), height=450, ), span=12, ), fac.AntdCol( simple_chart_card( title="流量转化情况", description="时间范围:当月", chart=fact.AntdColumn( data=[ { "action": "浏览网站", "pv": 50000, }, { "action": "放入购物车", "pv": 35000, }, { "action": "生成订单", "pv": 25000, }, { "action": "支付订单", "pv": 15000, }, { "action": "完成交易", "pv": 8500, }, ], xField="action", yField="pv", conversionTag={}, color="#2e8fff", ), height=450, ), span=12, ), fac.AntdCol( simple_chart_card( title="流量转化具体链路", description="时间范围:当月", chart=fact.AntdSankey( data=[ { "source": "首次打开", "target": "首页 UV", "value": 160, }, { "source": "结果页", "target": "首页 UV", "value": 40, }, { "source": "验证页", "target": "首页 UV", "value": 10, }, { "source": "我的", "target": "首页 UV", "value": 10, }, {"source": "朋友", "target": "首页 UV", "value": 8}, { "source": "其他来源", "target": "首页 UV", "value": 27, }, { "source": "首页 UV", "target": "理财", "value": 30, }, { "source": "首页 UV", "target": "扫一扫", "value": 40, }, { "source": "首页 UV", "target": "服务", "value": 35, }, { "source": "首页 UV", "target": "蚂蚁森林", "value": 25, }, { "source": "首页 UV", "target": "跳失", "value": 10, }, { "source": "首页 UV", "target": "借呗", "value": 30, }, { "source": "首页 UV", "target": "花呗", "value": 40, }, { "source": "首页 UV", "target": "其他流向", "value": 45, }, ], sourceField="source", targetField="target", weightField="value", nodeWidthRatio=0.008, nodePaddingRatio=0.03, nodeDraggable=True, ), height=375, ), span=24, ), fac.AntdCol( simple_chart_card( title="内容运营情况", description="时间范围:近10天", chart=fact.AntdArea( data=[ { "date": date, "type": type, "value": random.randint(50, 1000), } for date in [ "03-01", "03-02", "03-03", "03-04", "03-05", "03-06", "03-07", "03-08", "03-09", "03-10", ] for type in [ "内容生产量", "内容点击量", "内容曝光量", "活跃用户数", ] ], xField="date", yField="value", seriesField="type", smooth=True, isStack=True, legend={"position": "top"}, ), height=500, ), span=16, ), fac.AntdCol( simple_chart_card( title="近期热门内容", description="时间范围:近10天", chart=fac.AntdTable( columns=[ { "title": "标题", "dataIndex": "title", "key": "title", }, { "title": "点击量", "dataIndex": "click", "key": "click", }, { "title": "内容链接", "dataIndex": "link", "key": "link", "renderOptions": { "renderType": "link", }, }, ], data=[ { "title": "示例内容标题xxx", "click": random.randint(100, 10000), "link": { "content": "点击访问", "href": "https://fact.feffery.tech/", }, } for i in range(18) ], size="small", pagination=False, tableLayout="fixed", maxHeight=325, bordered=True, ), height=500, ), span=8, ), # 空白卡片示例 fac.AntdCol( blank_card( fac.AntdCenter( fac.AntdText( [ fac.AntdText("玩转Dash", italic=True), "知识星球出品", ] ) ) ), span=24, ), ], gutter=[18, 18], ), ], id="dashboard-container", style=style( padding=50, background="#f5f5f5", minHeight="100vh", boxSizing="border-box" ), ) app.layout = layout @app.callback( Output("export-dashboard-to-image", "targetSelector"), Input("export-pdf", "nClicks"), prevent_initial_call=True, ) def export_dashboard_to_image(n_clicks): """触发仪表盘目标容器导出为图片数据动作""" # 额外设置导出按钮相关提示信息 set_props("export-pdf", {"tooltip": "导出中,请稍候", "icon": fac.AntdIcon(icon="antd-loading")}) # 对应仪表盘容器id的选择器 return "#dashboard-container" @app.callback(Input("export-dashboard-to-image", "screenshotResult")) def export_dashboard_image_to_pdf(screen_shot_result): """将最近一次生成的仪表盘内容图片数据导出为pdf文件""" # 提取已导出图片有效部分数据 base64_data = screen_shot_result["dataUrl"].split(",")[1] # 解码base64字符串 image_data = base64.b64decode(base64_data) # 将图片数据转换为PIL图像对象 image = Image.open(io.BytesIO(image_data)) # 构造pdf文档 pdf = FPDF(unit="pt", format=[image.width, image.height]) pdf.add_page() # 写出临时图片文件 temp_file_name = ".{}.png".format(uuid.uuid4()) image.save(temp_file_name) pdf.image(temp_file_name, x=0, y=0, w=image.width, h=image.height) # 创建临时pdf所需io流 temp_pdf_io = io.BytesIO(pdf.output()) # 清理临时图片文件 os.remove(temp_file_name) # 返回下载目标结果 set_props("global-download", {"data": dcc.send_bytes(temp_pdf_io.getvalue(), "仪表盘导出结果.pdf")}) # 还原导出按钮提示信息 set_props("export-pdf", {"tooltip": "导出仪表盘为pdf", "icon": fac.AntdIcon(icon="antd-cloud-download")}, ) if __name__ == "__main__": app.run(debug=True)
演示效果
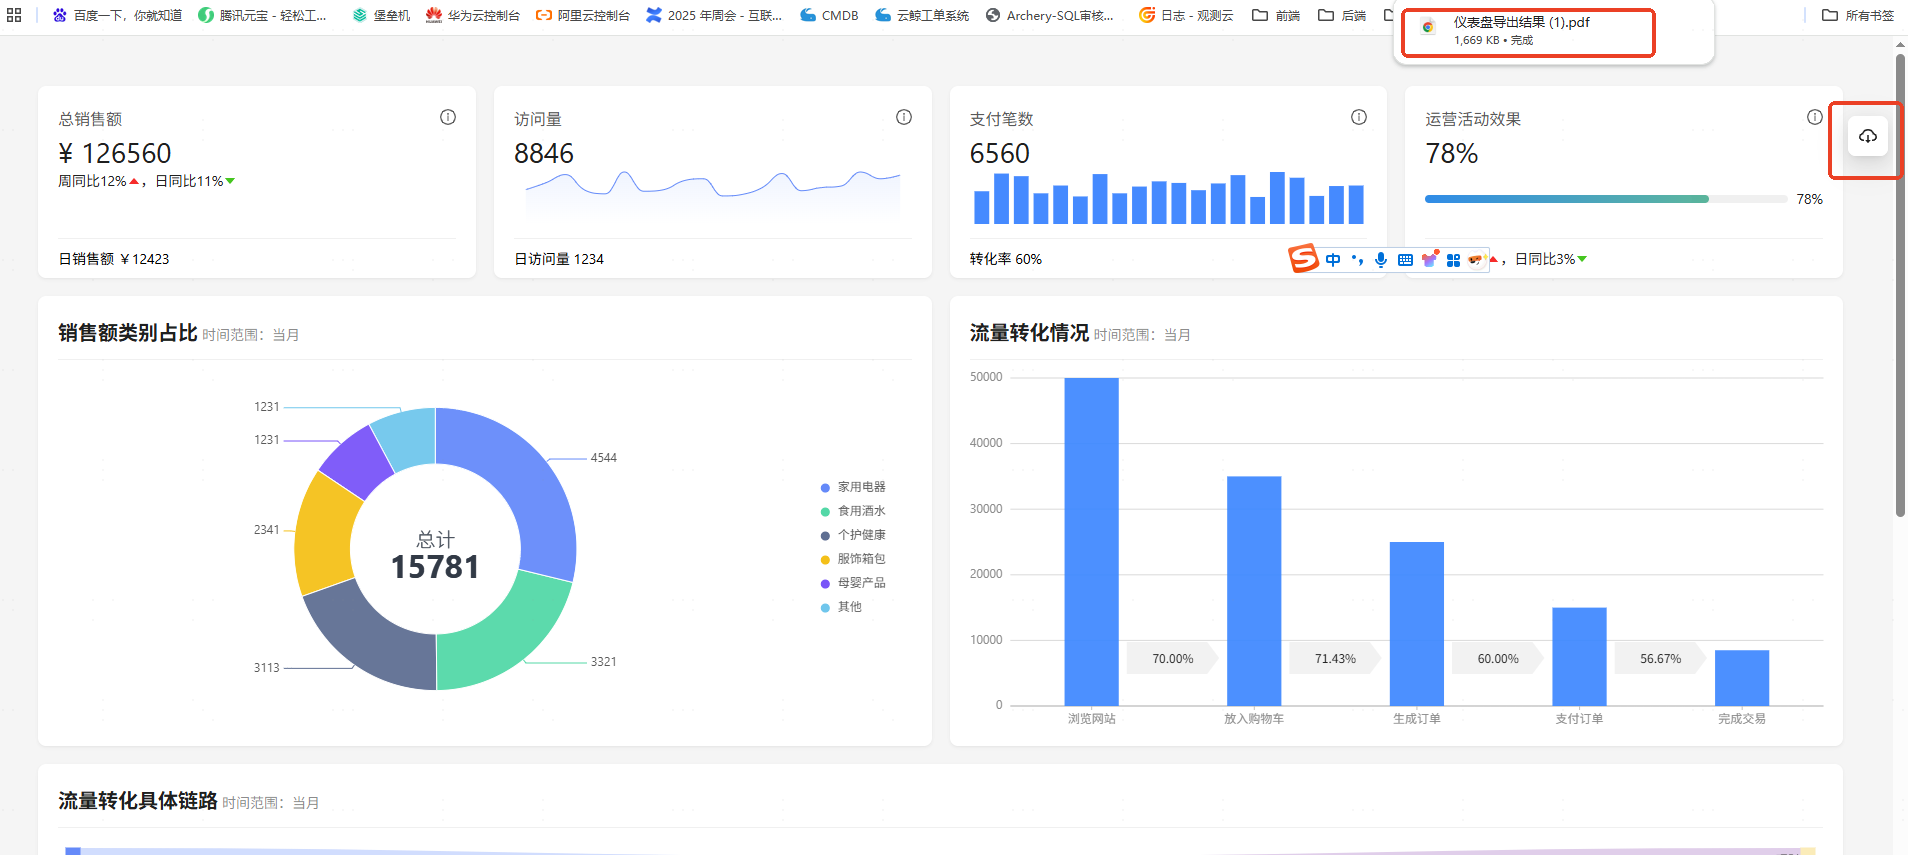
导出后的文件
具备实时数据更新的仪表盘
import dash import random from datetime import datetime import feffery_antd_charts as fact import feffery_antd_components as fac import feffery_utils_components as fuc from dash import html, dcc, set_props, Patch from feffery_dash_utils.style_utils import style from dash.dependencies import Input, Output, State from feffery_dash_utils.template_utils.dashboard_components import ( welcome_card, blank_card, index_card, simple_chart_card, ) app = dash.Dash(__name__, update_title=None) def layout(): return html.Div( [ # 消息提示输出目标 fac.Fragment(id="message-target"), # 数据统一更新轮询 dcc.Interval( id="update-data-interval", interval=3000, # 示例,3秒更新一次 ), # 仪表盘网格布局 fac.AntdRow( [ # 欢迎卡片 fac.AntdCol( welcome_card( title="欢迎访问本应用,用户:张三", description=fac.AntdText( [ "您有5个事项待处理,点击", html.A("此处", id="demo-link1"), "查看。", ] ), avatar=fac.AntdAvatar( src="/assets/demo-avatar.png", mode="image", size=72, style=style(background="#1890ff"), ), extra=fac.AntdButton( "更多信息", id="demo-link2", type="link" ), ), span=24, ), # 展示数据更新时间 fac.AntdCol( blank_card( fac.AntdText( [ "数据最近更新时间:", fac.AntdText( datetime.now().strftime("%Y-%m-%d %H:%M:%S"), id="update-datetime", type="secondary", ), ] ) ), span=24, ), # 指标卡片示例 fac.AntdCol( index_card( index_name="当日销售额", index_value=[ "¥ ", html.Span( 102389, id="today-sales", ), ], index_description="这是当日销售额的指标描述示例内容", footer_content="昨日销售额 ¥123456", ), span=6, ), fac.AntdCol( index_card( index_name="当日访问量", index_value=html.Span( fuc.FefferyCountUp(end=8846, separator=""), id="today-visits", ), index_description="这是当日访问量的指标描述示例内容", extra_content=fact.AntdTinyArea( id="today-visits-chart", data=[random.randint(20, 50) for _ in range(10)], height=60, smooth=True, ), footer_content="昨日访问量 6789", ), span=6, ), fac.AntdCol( index_card( index_name="当日支付笔数", index_value=html.Span( 4678, id="today-orders", ), index_description="这是当日支付笔数的指标描述示例内容", extra_content=fact.AntdTinyColumn( id="today-orders-chart", data=[random.randint(50, 100) for _ in range(10)], height=60, color="#2389ff", columnWidthRatio=0.75, ), footer_content="昨日支付笔数 5678", ), span=6, ), fac.AntdCol( index_card( index_name="当日活动转化率", index_value=html.Span( "78%", id="today-conversion-rate", ), index_description="这是运营活动效果的指标描述示例内容", extra_content=fac.AntdCenter( fac.AntdProgress( id="today-conversion-rate-chart", percent=78, status="active", strokeColor={"from": "#128ee7", "to": "#6cc085"}, ), style=style(height="100%"), ), footer_content="昨日活动转化率 75%", ), span=6, ), # 图表卡片示例 fac.AntdCol( simple_chart_card( title="销售额类别占比", description="时间范围:今日", chart=fact.AntdPie( id="today-sales-class-chart", data=[ { "type": "家用电器", "value": 4544, }, { "type": "食用酒水", "value": 3321, }, { "type": "个护健康", "value": 3113, }, { "type": "服饰箱包", "value": 2341, }, { "type": "母婴产品", "value": 1231, }, { "type": "其他", "value": 1231, }, ], colorField="type", angleField="value", radius=0.8, innerRadius=0.6, label={"type": "spider"}, ), height=450, ), span=12, ), fac.AntdCol( simple_chart_card( title="流量转化情况", description="时间范围:今日", chart=fact.AntdColumn( id="today-conversion-chart", data=[ { "action": "浏览网站", "pv": 50000, }, { "action": "放入购物车", "pv": 35000, }, { "action": "生成订单", "pv": 25000, }, { "action": "支付订单", "pv": 15000, }, { "action": "完成交易", "pv": 8500, }, ], xField="action", yField="pv", conversionTag={}, color="#2e8fff", ), height=450, ), span=12, ), # 空白卡片示例 fac.AntdCol( blank_card( fac.AntdCenter( fac.AntdText( [ fac.AntdText("玩转Dash", italic=True), "知识星球出品", ] ) ) ), span=24, ), ], gutter=[18, 18], ), ], style=style( padding=50, background="#f5f5f5", minHeight="100vh", boxSizing="border-box" ), ) app.layout = layout @app.callback([Input("demo-link1", "n_clicks"), Input("demo-link2", "nClicks")]) def link_click_demo(*args): """链接点击交互演示""" set_props( "message-target", { "children": fac.AntdMessage( content="你点击了链接 " + dash.ctx.triggered_id, type="info" ) }, ) @app.callback( [ Output("update-datetime", "children"), Output("today-sales", "children"), Output("today-visits", "children"), Output("today-visits-chart", "data"), Output("today-orders", "children"), Output("today-orders-chart", "data"), Output("today-conversion-rate", "children"), Output("today-conversion-rate-chart", "percent"), Output("today-sales-class-chart", "data"), Output("today-conversion-chart", "data"), ], Input("update-data-interval", "n_intervals"), [ State("today-sales", "children"), State("today-visits", "children"), State("today-orders", "children"), State("today-conversion-rate-chart", "percent"), State("today-sales-class-chart", "data"), State("today-conversion-chart", "data"), ], prevent_initial_call=True, ) def update_dashboard_data( n_intervals, origin_today_sales, origin_today_visits, origin_today_orders, origin_today_conversion_rate, origin_today_sales_class_chart_data, origin_today_conversion_chart_data, ): """处理仪表盘中各目标的实时数据更新""" # 模拟最新实时数据的获取 # 当日销售额 next_today_sales = origin_today_sales + random.randint(50, 100) # 当日访问量 today_visits_chunk = random.randint(20, 50) # 更新数字递增组件参数 origin_today_visits["props"]["start"] = origin_today_visits["props"]["end"] origin_today_visits["props"]["end"] = ( origin_today_visits["props"]["end"] + today_visits_chunk ) next_today_visits = origin_today_visits # 当日访问量分时段图表数据 today_visits_chart_data_patch = Patch() today_visits_chart_data_patch.append(today_visits_chunk) # 当日订单量 today_orders_chunk = random.randint(50, 100) next_today_orders = origin_today_orders + today_orders_chunk # 当日订单量分时段图表数据 today_orders_chart_data_patch = Patch() today_orders_chart_data_patch.append(today_orders_chunk) # 当日活动转化率 next_today_conversion_rate = round( origin_today_conversion_rate + random.uniform(-1, 1), 1 ) # 修正模拟数据 if next_today_conversion_rate > 100: next_today_conversion_rate = 100 # 销售额类别占比 for i in range(len(origin_today_sales_class_chart_data)): origin_today_sales_class_chart_data[i]["value"] += random.randint(5, 20) # 流量转化情况 for i in range(len(origin_today_conversion_chart_data)): origin_today_conversion_chart_data[i]["pv"] += random.randint(10, 20) return [ datetime.now().strftime("%Y-%m-%d %H:%M:%S"), next_today_sales, next_today_visits, today_visits_chart_data_patch, next_today_orders, today_orders_chart_data_patch, f"{next_today_conversion_rate}%", next_today_conversion_rate, origin_today_sales_class_chart_data, origin_today_conversion_chart_data, ] if __name__ == "__main__": app.run(debug=True)
效果演示
动态效果, 每隔3s 会进行自动更新, 以定时器的方式去实现
本文来自博客园,作者:羊驼之歌,转载请注明原文链接:https://www.cnblogs.com/shijieli/p/18884688

 浙公网安备 33010602011771号