
SpringCloud2.0 Hystrix Dashboard 断路器指标看板
原文:https://www.cnblogs.com/songlu/p/9973856.html
1、启动基础工程
1.1、启动【服务中心】集群,工程名称:springcloud-eureka-server
1.2、启动【服务提供者】集群,工程名称:springcloud-eureka-client
1.3、启动【服务消费者】,工程名称:springcloud-eureka-ribbon
1.4、启动【服务消费者】,工程名称:springcloud-eureka-feign
2、创建【断路器指标看板】,即 Hystrix Dashboard
2.1、新建 Spring Boot 工程,工程名称:springcloud-eureka-hystrix-dashboard
2.2、工程 pom.xml 文件添加如下依赖:
|
1
2
3
4
5
6
7
8
9
10
11
12
13
14
15
16
|
<dependency> <groupId>org.springframework.boot</groupId> <artifactId>spring-boot-starter-actuator</artifactId></dependency><dependency> <groupId>org.springframework.boot</groupId> <artifactId>spring-boot-starter-web</artifactId></dependency><dependency> <groupId>org.springframework.cloud</groupId> <artifactId>spring-cloud-starter-netflix-eureka-client</artifactId></dependency><dependency> <groupId>org.springframework.cloud</groupId> <artifactId>spring-cloud-starter-netflix-hystrix-dashboard</artifactId></dependency> |
2.3、在工程启动类中,添加注解 @EnableDiscoveryClient,@EnableHystrixDashboard
|
1
2
3
4
5
6
7
8
9
10
11
12
13
14
15
16
17
18
19
20
21
22
23
|
package com.miniooc.eurekahystrixdashboard;import org.springframework.boot.SpringApplication;import org.springframework.boot.autoconfigure.SpringBootApplication;import org.springframework.cloud.client.discovery.EnableDiscoveryClient;import org.springframework.cloud.netflix.hystrix.dashboard.EnableHystrixDashboard;/** * EurekaHystrixDashboardApplication * * @author 宋陆 * @version 1.0.0 */@EnableHystrixDashboard // 启用 HystrixDashboard 断路器看板 相关配置@EnableDiscoveryClient // 启用 Eureka 服务发现 相关配置@SpringBootApplicationpublic class EurekaHystrixDashboardApplication { public static void main(String[] args) { SpringApplication.run(EurekaHystrixDashboardApplication.class, args); }} |
2.4、新建工程配置文件 application.yml ,配置内容:
|
1
2
3
4
5
6
7
8
9
10
11
12
13
14
15
16
17
18
19
20
21
|
server: port: 52630spring: application: name: eureka-hystrix-dashboardeureka: instance: hostname: localhost # 表示eureka client间隔多久去拉取服务注册信息,默认为30秒,如果要迅速获取服务注册状态,可以缩小该值 lease-renewal-interval-in-seconds: 5 # 表示eureka server至上一次收到client的心跳之后,等待下一次心跳的超时时间,在这个时间内若没收到下一次心跳,则将移除该instance。 # 默认为90秒 # 如果该值太大,则很可能将流量转发过去的时候,该instance已经不存活了。 # 如果该值设置太小了,则instance则很可能因为临时的网络抖动而被摘除掉。 # 该值至少应该大于 leaseRenewalIntervalInSeconds lease-expiration-duration-in-seconds: 10 client: serviceUrl: defaultZone: http://localhost:9527/eureka/,http://localhost:9528/eureka/,http://localhost:9529/eureka/ |
2.5、启动【断路器指标看板】工程
2.6、打开浏览器,访问 http://localhost:52630/hystrix
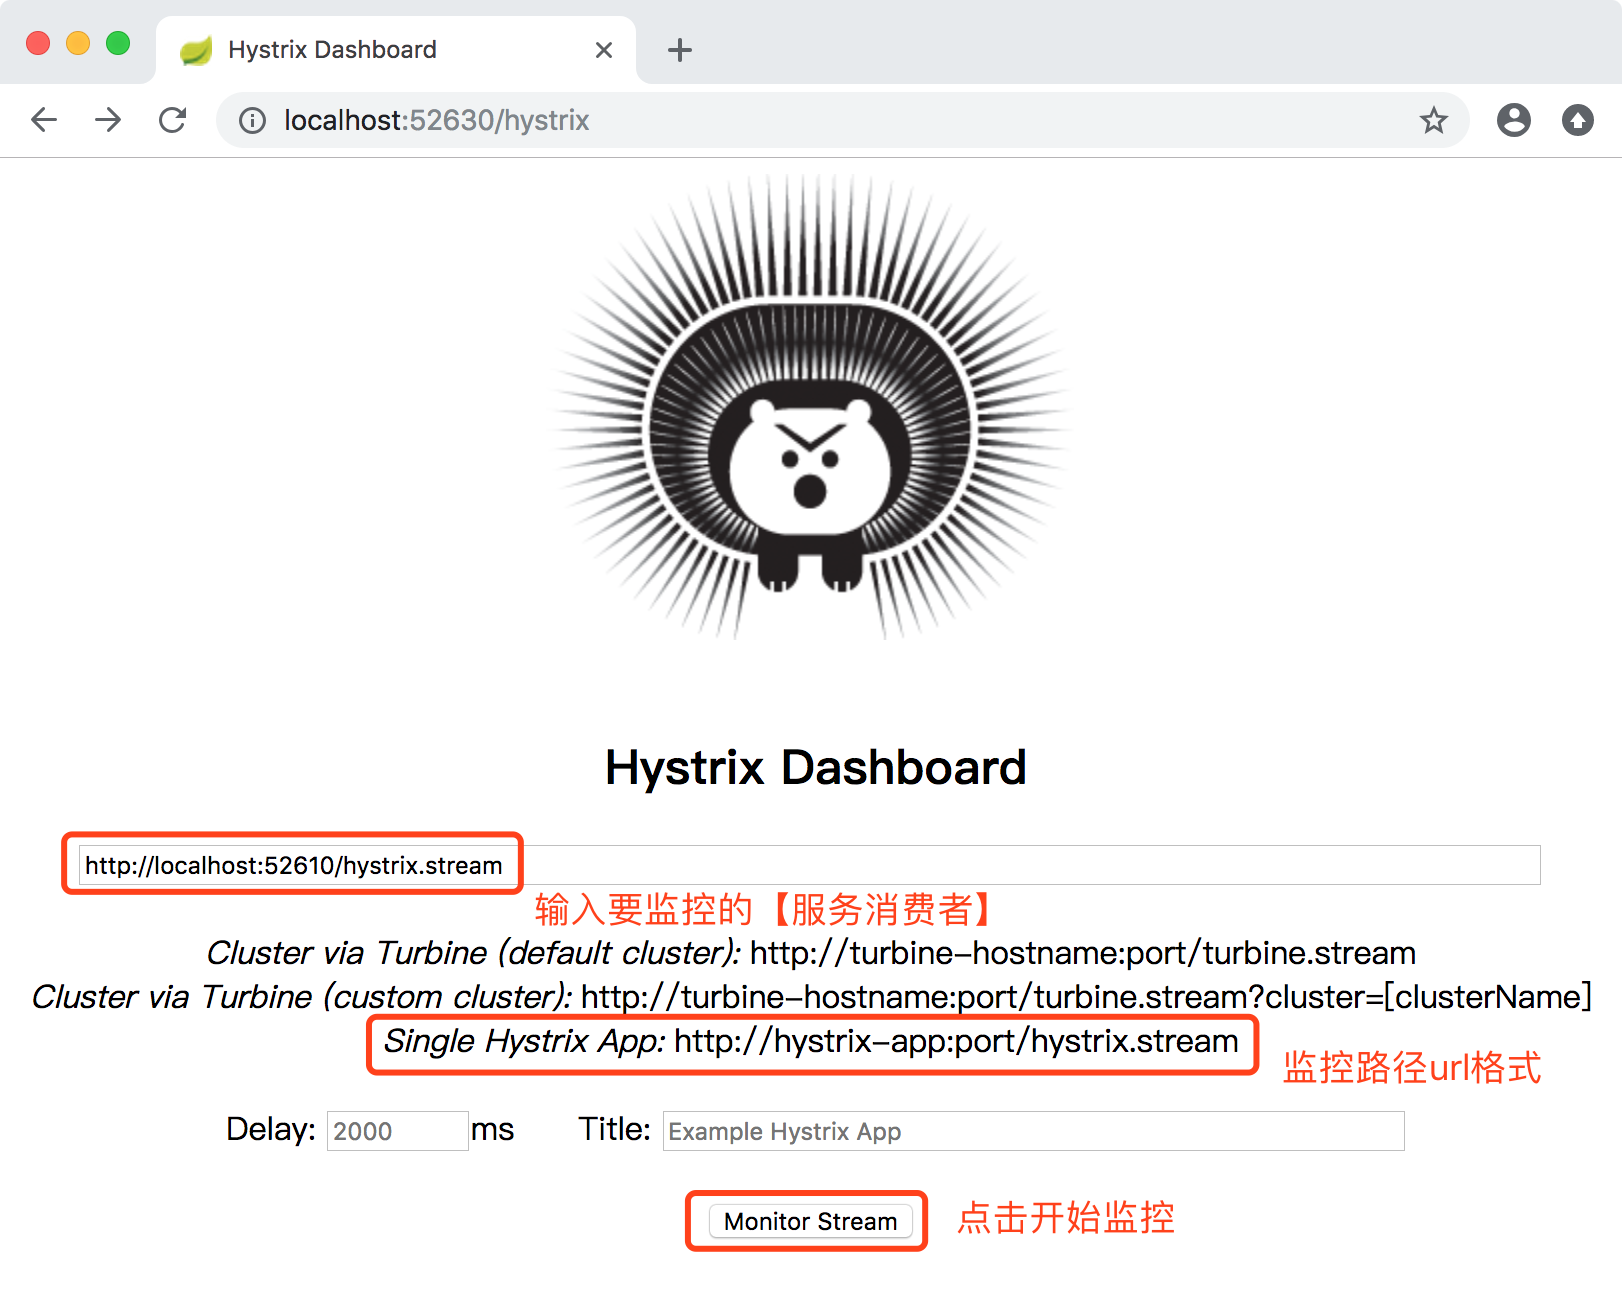
2.7、监控地址输入 http://localhost:52610/hystrix.stream 来监控 springcloud-eureka-ribbon 服务,点击【Monitor Stream】按钮,开启断路器指标看板
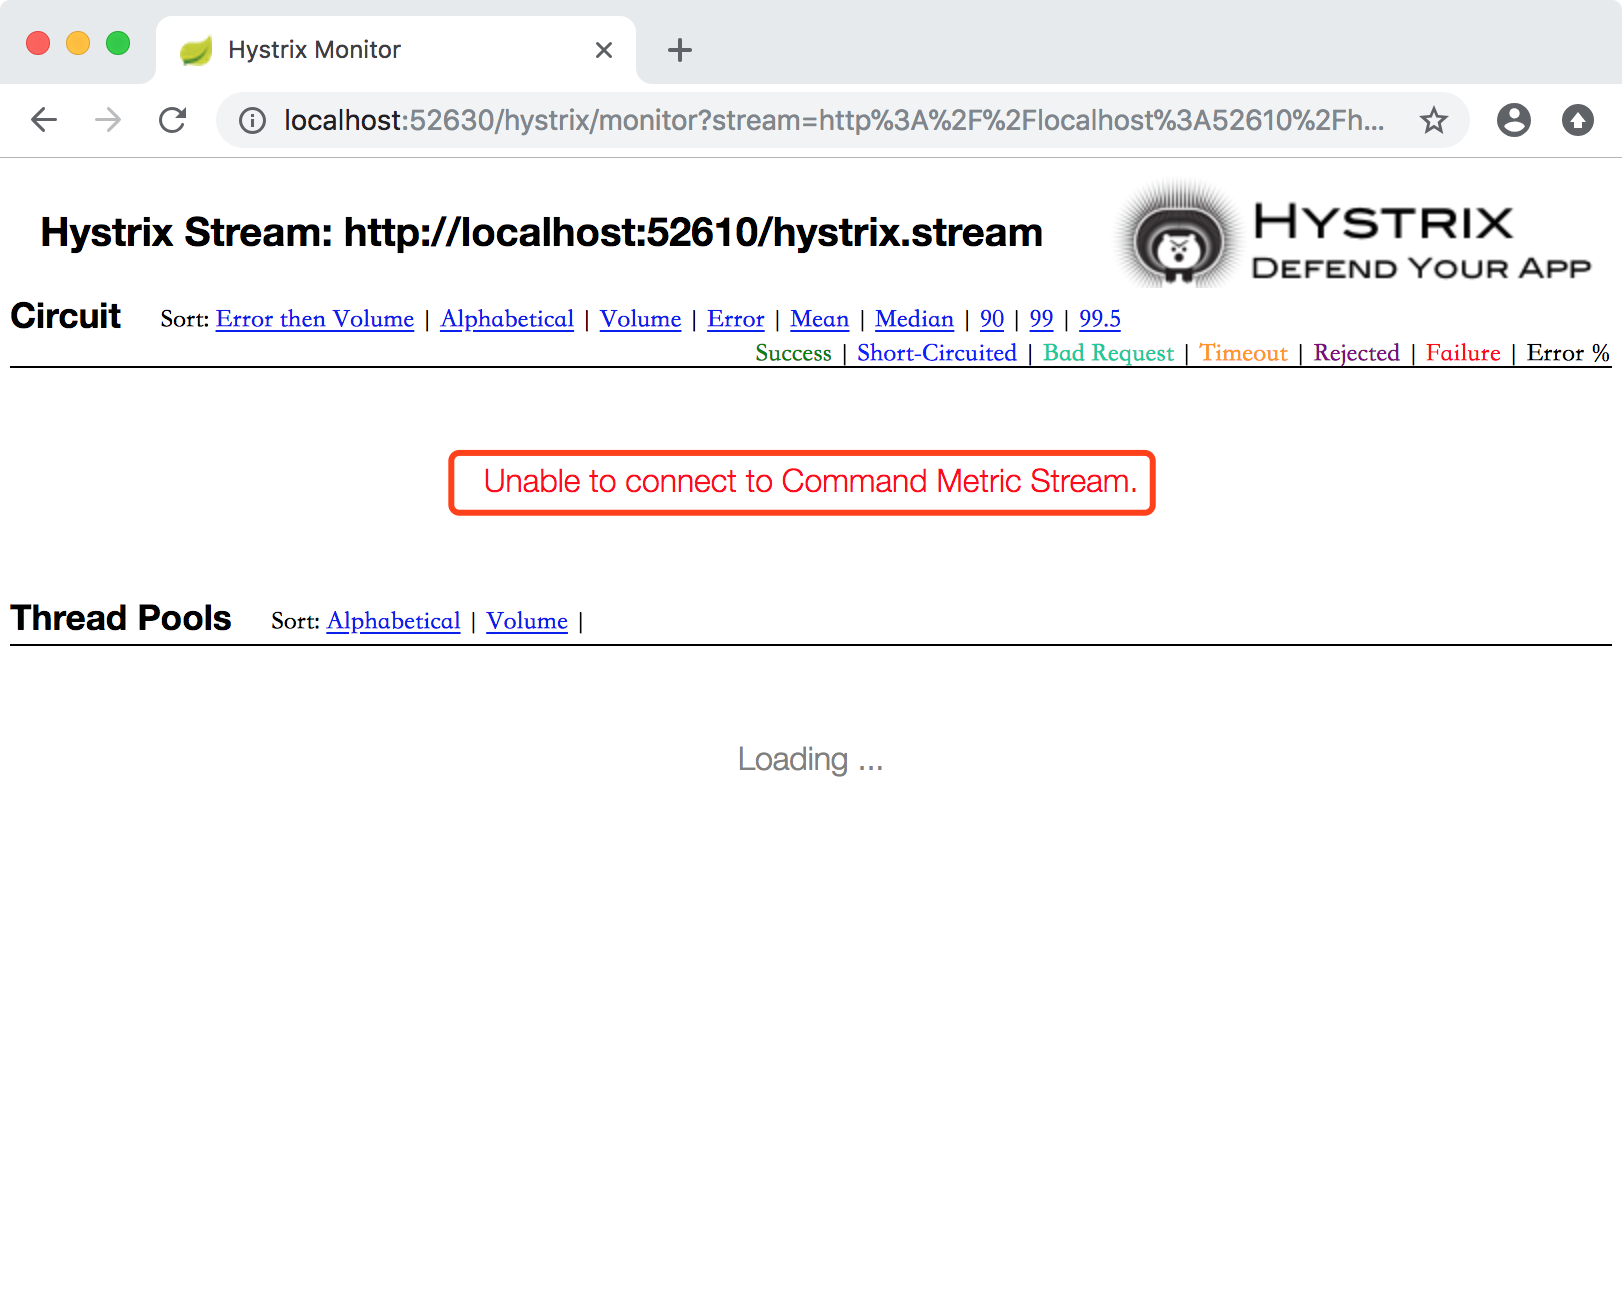
报了一个红色提示,Unable to connect to Command Metric Stream.这是因为我们开启监控的断路器流 Hystrix Stream: http://localhost:52610/hystrix.stream。这个路径,不是springboot工程默认路径,也不是hystrix默认路径。
解决方案:修改【服务消费者】工程,注册断路器指标流Servlet
2.8、修改【服务消费者】工程,工程名称:springcloud-eureka-ribbon,修改EurekaRibbonConfig类,注册断路器指标流Servlet
|
1
2
3
4
5
6
7
8
9
10
11
12
13
14
15
16
17
18
19
20
21
22
23
24
25
26
27
28
29
30
31
32
33
34
35
|
package com.miniooc.eurekaribbon.config;import com.netflix.hystrix.contrib.metrics.eventstream.HystrixMetricsStreamServlet;import org.springframework.boot.web.servlet.ServletRegistrationBean;import org.springframework.cloud.client.loadbalancer.LoadBalanced;import org.springframework.context.annotation.Bean;import org.springframework.context.annotation.Configuration;import org.springframework.web.client.RestTemplate;/** * EurekaRibbonConfig * 应用配置类,初始化 Bean和配置信息 * * @author 宋陆 * @version 1.0.0 */@Configurationpublic class EurekaRibbonConfig { @Bean // 初始化 Bean @LoadBalanced // 实现负载均衡 public RestTemplate restTemplate() { return new RestTemplate(); } @Bean public ServletRegistrationBean getServlet() { HystrixMetricsStreamServlet streamServlet = new HystrixMetricsStreamServlet(); ServletRegistrationBean registrationBean = new ServletRegistrationBean(streamServlet); registrationBean.setLoadOnStartup(1); registrationBean.addUrlMappings("/hystrix.stream"); registrationBean.setName("HystrixMetricsStreamServlet"); return registrationBean; }} |
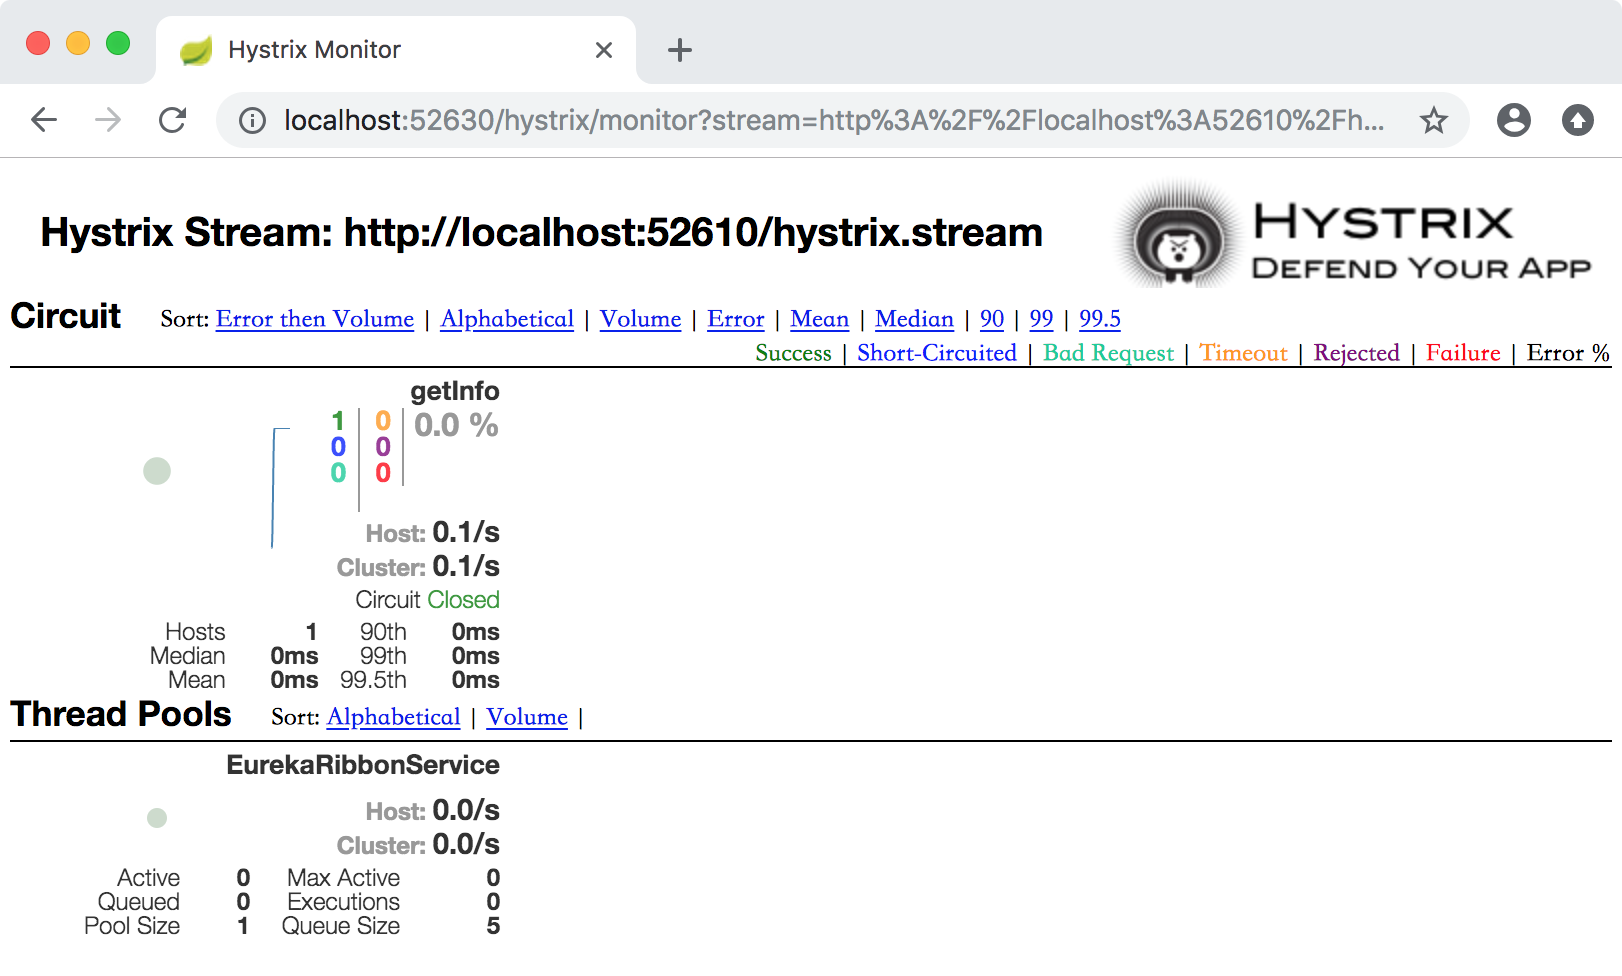
2.9、重启【服务消费者】springcloud-eureka-ribbon 服务。刷新【断路器指标看板】页面
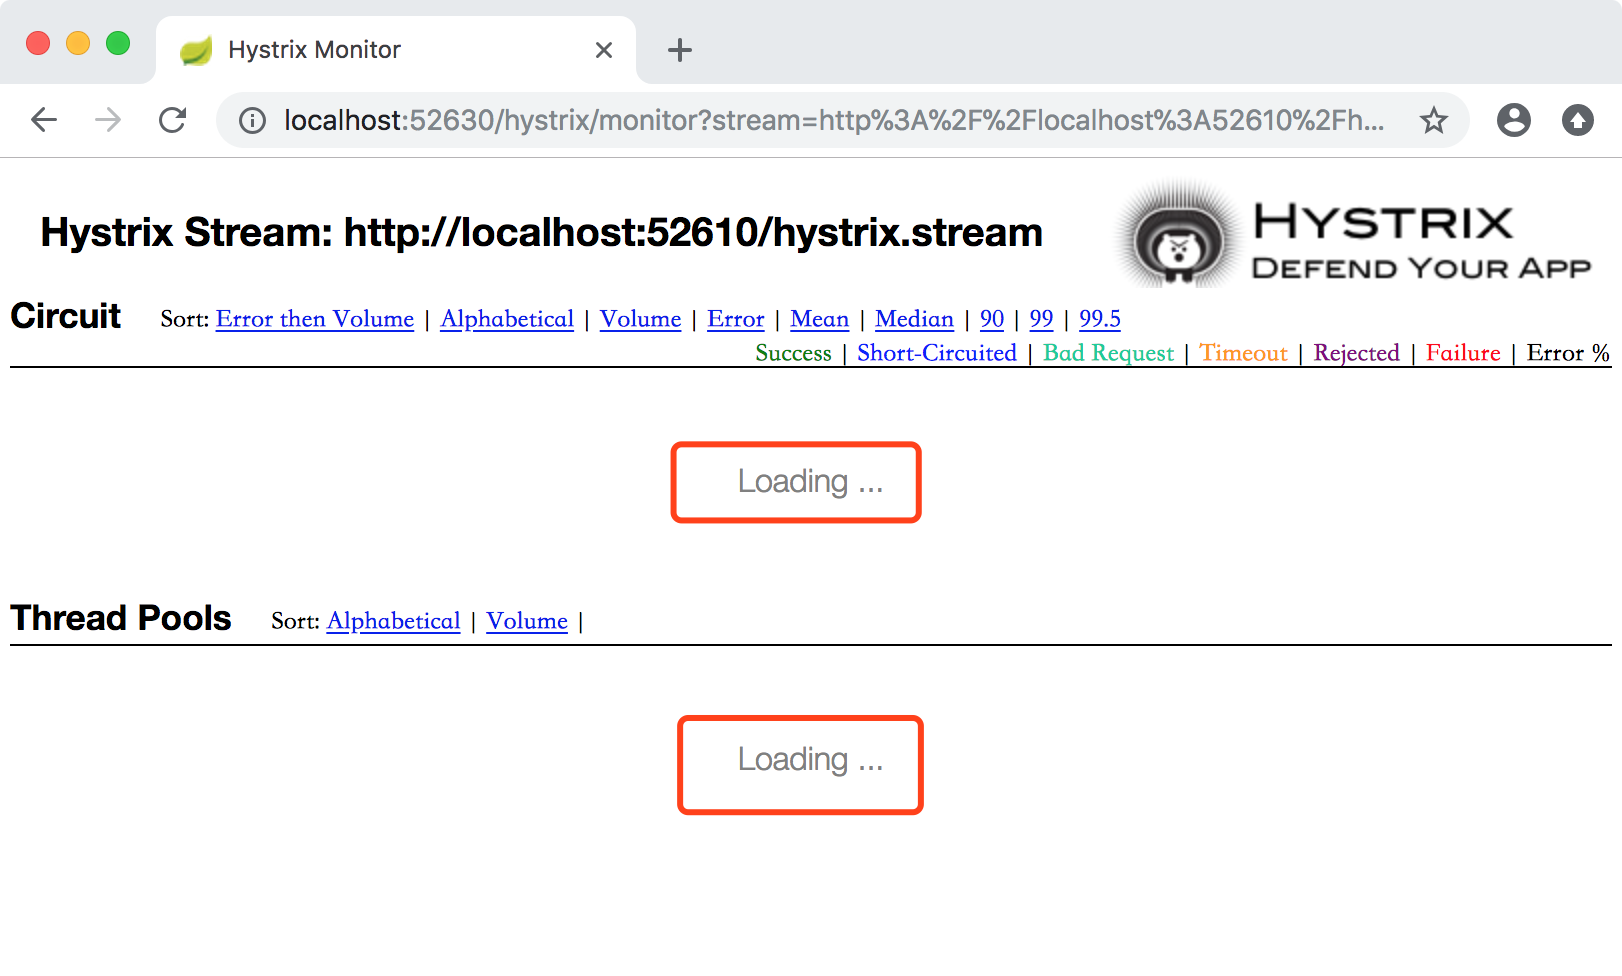
红框处 Loading... 状态,是因为重启【服务消费者】后,没有任何请求,所以,也就没有任何数据流产生。监控页面就处于加载中。只要我们请求一下 http://localhost:52610/ribbonInfo,就可以看到数据指标了。
2.10、新开浏览器窗口,访问 http://localhost:52630/hystrix
2.11、监控地址输入 http://localhost:52620/hystrix.stream 来监控 springcloud-eureka-feign 服务,点击【Monitor Stream】按钮,开启断路器指标看板
依旧是同样的问题,Unable to connect to Command Metric Stream。
解决方案:修改【服务消费者】工程,注册断路器指标流Servlet
2.12、修改【服务消费者】工程,工程名称:springcloud-eureka-feign,新增EurekaFeignConfig类,注册断路器指标流Servlet
|
1
2
3
4
5
6
7
8
9
10
11
12
13
14
15
16
17
18
19
20
21
22
23
24
25
26
27
28
29
30
|
package com.miniooc.eurekafeign.config;import com.netflix.hystrix.contrib.metrics.eventstream.HystrixMetricsStreamServlet;import org.springframework.boot.web.servlet.ServletRegistrationBean;import org.springframework.cloud.client.loadbalancer.LoadBalanced;import org.springframework.context.annotation.Bean;import org.springframework.context.annotation.Configuration;import org.springframework.web.client.RestTemplate;/** * EurekaFeignConfig * 应用配置类,初始化 Bean和配置信息 * * @author 宋陆 * @version 1.0.0 */@Configurationpublic class EurekaFeignConfig { @Bean public ServletRegistrationBean getServlet() { HystrixMetricsStreamServlet streamServlet = new HystrixMetricsStreamServlet(); ServletRegistrationBean registrationBean = new ServletRegistrationBean(streamServlet); registrationBean.setLoadOnStartup(1); registrationBean.addUrlMappings("/hystrix.stream"); registrationBean.setName("HystrixMetricsStreamServlet"); return registrationBean; }} |
2.13、重启【服务消费者】springcloud-eureka-feign 服务。刷新【断路器指标看板】页面
依旧是 Loading... 问题,只要我们请求一下 http://localhost:52610/feignInfo,就可以看到数据指标了。

看完打开支付宝扫一扫领个红包吧!


 浙公网安备 33010602011771号