

prometheus 集群
思路一
统一区域的监控目标,prometheus server两台监控相同的目标群体。

改变后

上面这个变化对于监控目标端,会多出一倍的查询请求,但在一台prometheus server宕机的情况下,可以不影响监控。
思路二
这是一个金字塔式的层次结构,而不是分布式层次结构。Prometheus 的抓取请求也会加载到prometheus work节点上,这是需要考虑的。
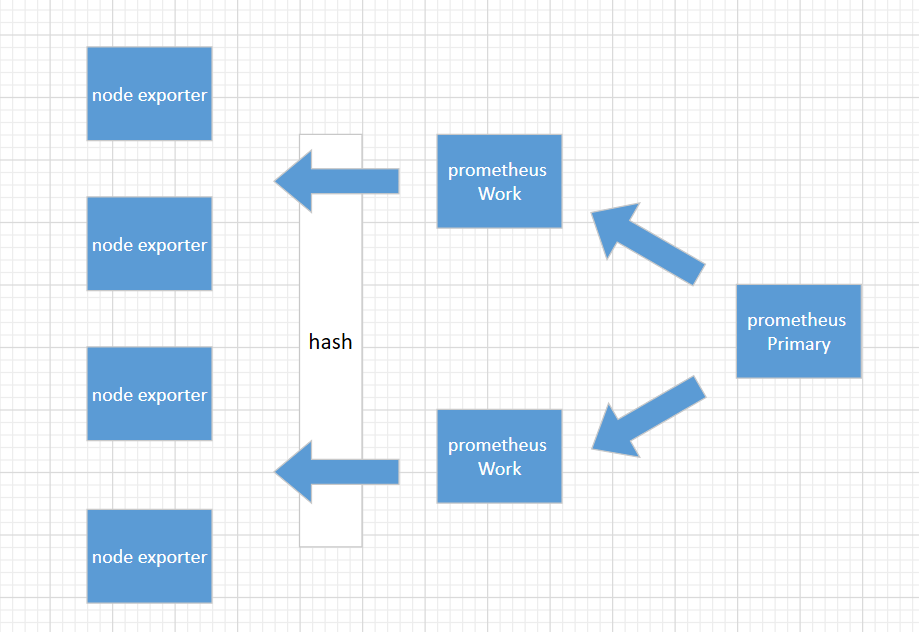
上面这种模式,准备3台prometheus server进行搭建,这种方式work节点一台宕机后,其它wokr节点不会去接手故障work节点的机器。
1、环境准备
192.168.31.151(primary)
192.168.31.144 (worker)
192.168.31.82(worker)
2、部署prometheus
cd /usr/loacl
tar -xvf prometheus-2.8.0.linux-amd64.tar.gz
ln -s /usr/local/prometheus-2.8.0.linux-amd64 /usr/local/prometheus
cd /usr/local/prometheus;mkdir bin conf data
mv ./promtool bin
mv ./prometheus bin
mv ./prometheus.yml conf
3、worker节点配置(192.168.31.144)
prometheus.yml
# my global config
global:
  scrape_interval:     15s # Set the scrape interval to every 15 seconds. Default is every 1 minute.
  evaluation_interval: 15s # Evaluate rules every 15 seconds. The default is every 1 minute.
  external_labels:
    worker: 0

# Alertmanager configuration
alerting:
  alertmanagers:
  - static_configs:
    - targets:
      # - alertmanager:9093

# Load rules once and periodically evaluate them according to the global 'evaluation_interval'.
rule_files:
  - "rules/*_rules.yml"

# A scrape configuration containing exactly one endpoint to scrape:
# Here it's Prometheus itself.
scrape_configs:
  # The job name is added as a label `job=<job_name>` to any timeseries scraped from this config.
  - job_name: 'prometheus'
    static_configs:
    - targets:
      - 192.168.31.151:9090
      - 192.168.31.144:9090
      - 192.168.31.82:9090
    relabel_configs:
    - source_labels: [__address__]
      modulus: 2
      target_label: __tmp_hash
      action: hashmod
    - source_labels: [__tmp_hash]
      regex: ^0$
      action: keep
  - job_name: 'node_exporter'
    file_sd_configs:
      - files:
        - targets/nodes/*.json
        refresh_interval: 1m
    relabel_configs:
    - source_labels: [__address__]
      modulus: 2
      target_label: __tmp_hash
      action: hashmod
    - source_labels: [__tmp_hash]
      regex: ^0$
      action: keep
  - job_name: 'docker'
    file_sd_configs:
      - files:
        - targets/docker/*.json
        refresh_interval: 1m
    relabel_configs:
    - source_labels: [__address__]
      modulus: 2
      target_label: __tmp_hash
      action: hashmod
    - source_labels: [__tmp_hash]
      regex: ^0$
      action: keep
  - job_name: 'alertmanager'
    static_configs:
    - targets:
      - 192.168.31.151:9093
      - 192.168.31.144:9093
    relabel_configs:
    - source_labels: [__address__]
      modulus: 2
      target_label: __tmp_hash
      action: hashmod
    - source_labels: [__tmp_hash]
      regex: ^0$
      action: keep
worker节点配置(192.168.31.82)
prometheus.yml
# my global config
global:
  scrape_interval:     15s # Set the scrape interval to every 15 seconds. Default is every 1 minute.
  evaluation_interval: 15s # Evaluate rules every 15 seconds. The default is every 1 minute.
  external_labels:
    worker: 1

# Alertmanager configuration
alerting:
  alertmanagers:
  - static_configs:
    - targets:
      # - alertmanager:9093

# Load rules once and periodically evaluate them according to the global 'evaluation_interval'.
rule_files:
  - "rules/*_rules.yml"

# A scrape configuration containing exactly one endpoint to scrape:
# Here it's Prometheus itself.
scrape_configs:
  # The job name is added as a label `job=<job_name>` to any timeseries scraped from this config.
  - job_name: 'prometheus'
    static_configs:
    - targets:
      - 192.168.31.151:9090
      - 192.168.31.144:9090
      - 192.168.31.82:9090
    relabel_configs:
    - source_labels: [__address__]
      modulus: 2
      target_label: __tmp_hash
      action: hashmod
    - source_labels: [__tmp_hash]
      regex: ^1$
      action: keep
  - job_name: 'node_exporter'
    file_sd_configs:
      - files:
        - targets/nodes/*.json
        refresh_interval: 1m
    relabel_configs:
    - source_labels: [__address__]
      modulus: 2
      target_label: __tmp_hash
      action: hashmod
    - source_labels: [__tmp_hash]
      regex: ^1$
      action: keep
  - job_name: 'docker'
    file_sd_configs:
      - files:
        - targets/docker/*.json
        refresh_interval: 1m
    relabel_configs:
    - source_labels: [__address__]
      modulus: 2
      target_label: __tmp_hash
      action: hashmod
    - source_labels: [__tmp_hash]
      regex: ^1$
      action: keep
  - job_name: 'alertmanager'
    static_configs:
    - targets:
      - 192.168.31.151:9093
      - 192.168.31.144:9093
    relabel_configs:
    - source_labels: [__address__]
      modulus: 2
      target_label: __tmp_hash
      action: hashmod
    - source_labels: [__tmp_hash]
      regex: ^1$
      action: keep
primary节点配置(192.168.31.151)
prometheus.yml
# my global config
global:
scrape_interval: 15s # Set the scrape interval to every 15 seconds. Default is every 1 minute.
evaluation_interval: 15s # Evaluate rules every 15 seconds. The default is every 1 minute.
# scrape_timeout is set to the global default (10s).
# Alertmanager configuration
alerting:
alertmanagers:
- static_configs:
- targets:
- 192.168.31.151:9093
- 192.168.31.144:9093
# Load rules once and periodically evaluate them according to the global 'evaluation_interval'.
rule_files:
- "rules/*_alerts.yml"
# A scrape configuration containing exactly one endpoint to scrape:
# Here it's Prometheus itself.
scrape_configs:
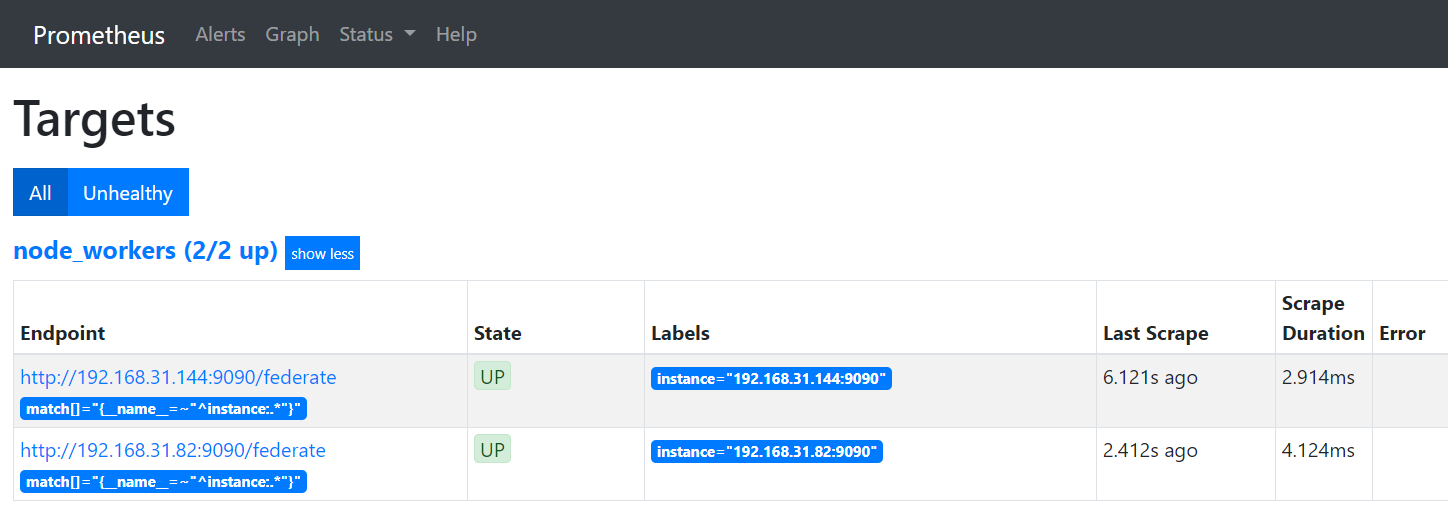
- job_name: 'node_workers'
file_sd_configs:
- files:
- 'targets/workers/*.json'
refresh_interval: 5m
honor_labels: true
metrics_path: /federate
params:
'match[]':
- '{__name__=~"^instance:.*"}'
cat ./targets/workers/workers.json
[{
  "targets": [
    "192.168.31.144:9090",
    "192.168.31.82:9090"
  ]
}]

 浙公网安备 33010602011771号