Matplotlib从文件绘图时Y轴坐标不正确
问题描述:
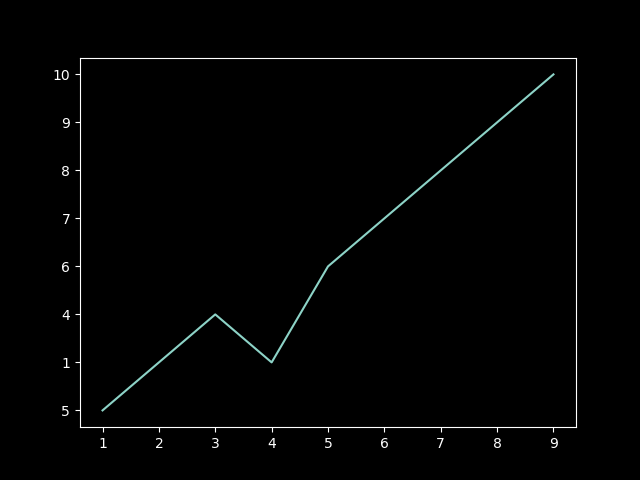
从文件中读取X坐标和Y坐标,绘制折线图,代码和结果如下:
import matplotlib.pyplot as plt
import matplotlib.animation as animation
from matplotlib import style


style.use('dark_background')

fig = plt.figure()


graph_data = open('example.txt','r').read()
lines = graph_data.split('\n')
xs = []
ys = []
for line in lines:
    if len(line) > 1:
        x, y = line.split(',')
        xs.append(x)
        ys.append(y)

plt.plot(xs, ys)
plt.show()
解决:
我想这种bug也只有计算机专业能想到吧。。。
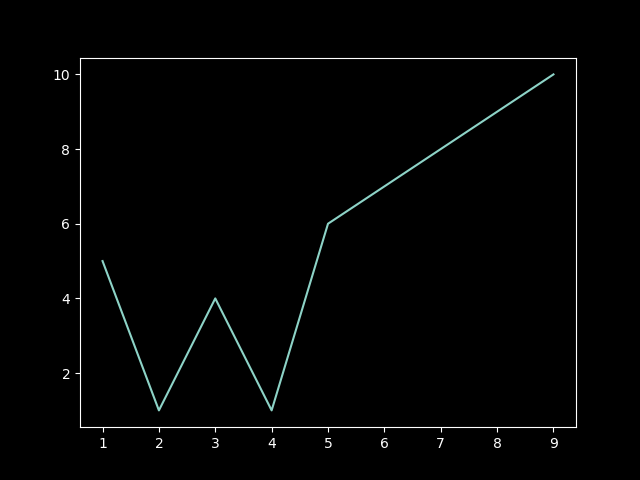
那就是——类型错误!从文件中读到的每个x和y为字符串,应该转换成int类型。改正后:
import matplotlib.pyplot as plt
import matplotlib.animation as animation
from matplotlib import style


style.use('dark_background')

fig = plt.figure()


graph_data = open('example.txt','r').read()
lines = graph_data.split('\n')
xs = []
ys = []
for line in lines:
    if len(line) > 1:
        x, y = line.split(',')
        xs.append(int(x)) #注意读取到的是字符串类型
        ys.append(int(y))

plt.plot(xs, ys)
plt.show()

 浙公网安备 33010602011771号