
prometheus监控k8s
使用prometheus监控node节点
使用cadvisor监控容器,最后使用grafana图形化显示数据
1、安装prometheus,需要将prometheus的配置文件映射进去,使用configMap方式映射
创建configMap,名字为pro
kubectl create configmap pro --from-file=./prometheus.yml
prometheus.yml文件内容,修改20行内容。'192.168.55:9090','192.168.3.55:8080' 端口9090监控的是node,8080监控的容器
 1 global:
 2   scrape_interval:     15s # By default, scrape targets every 15 seconds.
 3   evaluation_interval: 15s # Evaluate rules every 15 seconds.
 4
 5   # Attach these labels to any time series or alerts when communicating with
 6   # external systems (federation, remote storage, Alertmanager).
 7   external_labels:
 8     monitor: 'codelab-monitor'
 9
10 rule_files:
11   # - 'prometheus.rules.yml'
12
13 scrape_configs:
14   - job_name: 'prometheus'
15
16     # Override the global default and scrape targets from this job every 5 seconds.
17     #     scrape_interval: 5s
18
19     static_configs:
20       - targets: ['192.168.3.55:9100','192.168.3.55:8080']
2、安装prometheus
vim prometheus_run.yml
 1 apiVersion: apps/v1
 2 kind: DaemonSet
 3 metadata:
 4  name: prometheus
 5 spec:
 6  selector:
 7   matchLabels:
 8     app: prometheus
 9  template:
10   metadata:
11     labels:
12       app: prometheus
13   spec:
14     hostNetwork: true
15     containers:
16     - name: prom
17       image: prom/prometheus
18       imagePullPolicy: IfNotPresent
19       ports:
20        - containerPort: 9090
21       volumeMounts:
22       - name: pro1
23         mountPath: /etc/prometheus/
24         readOnly: true
25     volumes:
26     - name: pro1
27       configMap:
28        name: pro
kubectl apply -f prometheus_run.yml
安装prometheus的node节点
vim node_exporter.yml
 1 apiVersion: apps/v1
 2 kind: DaemonSet
 3 metadata:
 4   name: node-exporter-daemonset
 5 spec:
 6   selector:
 7     matchLabels:
 8       name: prometheus
 9   template:
10     metadata:
11       labels:
12         name: prometheus
13     spec:
14       hostNetwork: true    #仅主机
15       containers:
16       - name: node-exporter   #容器名字
17         image: prom/node-exporter    #使用客户端的镜像名称
18         ports:
19         - containerPort: 9100
20         imagePullPolicy: IfNotPresent    #镜像策略。如果没有这个镜像就下载
21         command:     #运行的命令:
22         - /bin/node_exporter
23         - --path.procfs
24         - /host/proc      #对应的目录
25         - --path.sysfs
26         - /host/sys
27         - --collector.filesystem.ignored-mount-points
28         - ^/(sys|proc|dev|host|etc|rootfs/var/lib/docker/containers|rootfs/var/lib/docker/overlay2|rootfs/run/docker/netns|rootfs/var/lib/docker/devicemapper|rootfs/var/lib/docker/aufs)($$|/)
29         volumeMounts:            #挂载对应关系,挂载到里面的目录
30         - name: proc
31           mountPath: /host/proc
32         - name: sys
33           mountPath: /host/sys
34         - name: root
35           mountPath: /rootfs
36       volumes:     #外面的目录,和containers是对齐的
37         - name: proc
38           hostPath:   #主机上的目录
39             path: /proc
40         - name: sys
41           hostPath:
42             path: /sys
43         - name: root
44           hostPath:
45             path: /
kubectl apply -f node_exporter.yml
3、安装cadvisor
vim cadvisor.yml
 1 apiVersion: apps/v1
 2 kind: DaemonSet
 3 metadata:
 4   name: cadvisor
 5 spec:
 6   selector:
 7     matchLabels:
 8       jk: cAdvisor
 9   template:
10     metadata:
11       labels:
12         jk: cAdvisor
13     spec:
14       hostNetwork: true
15       restartPolicy: Always   # 不管什么问题总是重启
16       containers:
17       - name: cadvisor
18         image: google/cadvisor
19         imagePullPolicy: IfNotPresent  # 镜像策略,如果本地没有则下载
20         ports:
21         - containerPort: 8080
22         volumeMounts:
23           - name: root
24             mountPath: /rootfs
25           - name: run
26             mountPath: /var/run
27           - name: sys
28             mountPath: /sys
29           - name: docker
30             mountPath: /var/lib/docker
31       volumes:
32       - name: root
33         hostPath:
34           path: /
35       - name: run
36         hostPath:
37           path: /var/run
38       - name: sys
39         hostPath:
40           path: /sys
41       - name: docker
42         hostPath:
43           path: /var/lib/docker
kubectl apply -f cadvisor.yml
4、安装grafana(web界面)
vim grafana.yml
 1 apiVersion: apps/v1
 2 kind: DaemonSet
 3 metadata:
 4   name: grafana
 5 spec:
 6   selector:
 7     matchLabels:
 8       name: grafana
 9   template:
10     metadata:
11       labels:
12          name: grafana
13     spec:
14       hostNetwork: true
15       containers:
16       - name: grafana
17         image: grafana/grafana
18         imagePullPolicy: IfNotPresent
19         ports:
20         - containerPort: 3000
21         env:
22         - name: GF_SERVER_ROOT_URL
23           value: "http://grafana.server.name"
24         - name: GF_SECURITY_ADMIN_PASSWORD
25           value: "123.com"
kubectl apply -f grafana.yml
查看pod运行状态
[root@master prometheus]# kubectl get pod
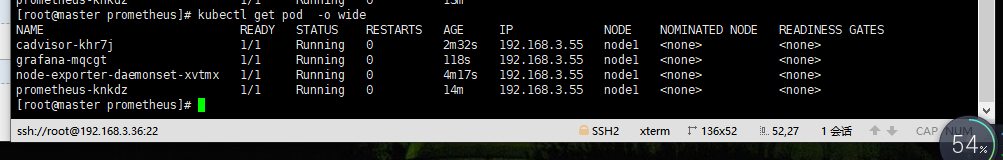
我们采用的是容器端口直接暴露在主机上(hostNetwork: true),使用主机IP+端口就可以访问到(http://192.168.3.55:9090/)
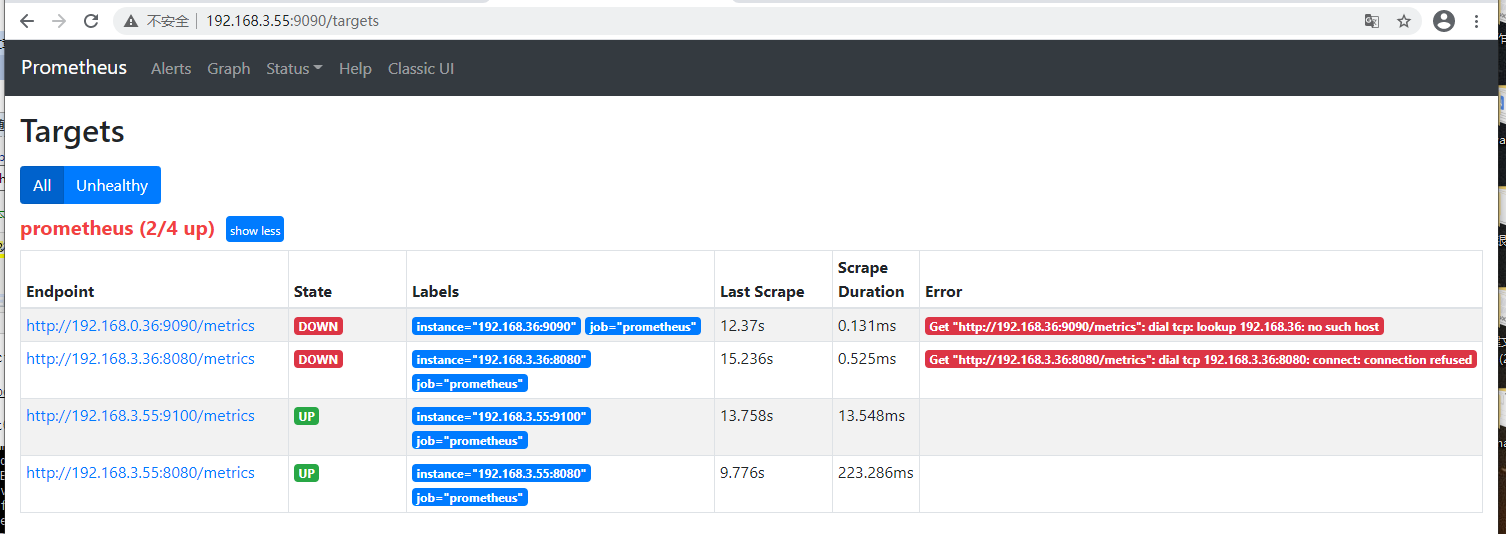
可以看到现在是正确的,主机36显示没有成功,是因为master默认有污点的,容器不会调度到master节点上,所以连接36报错。
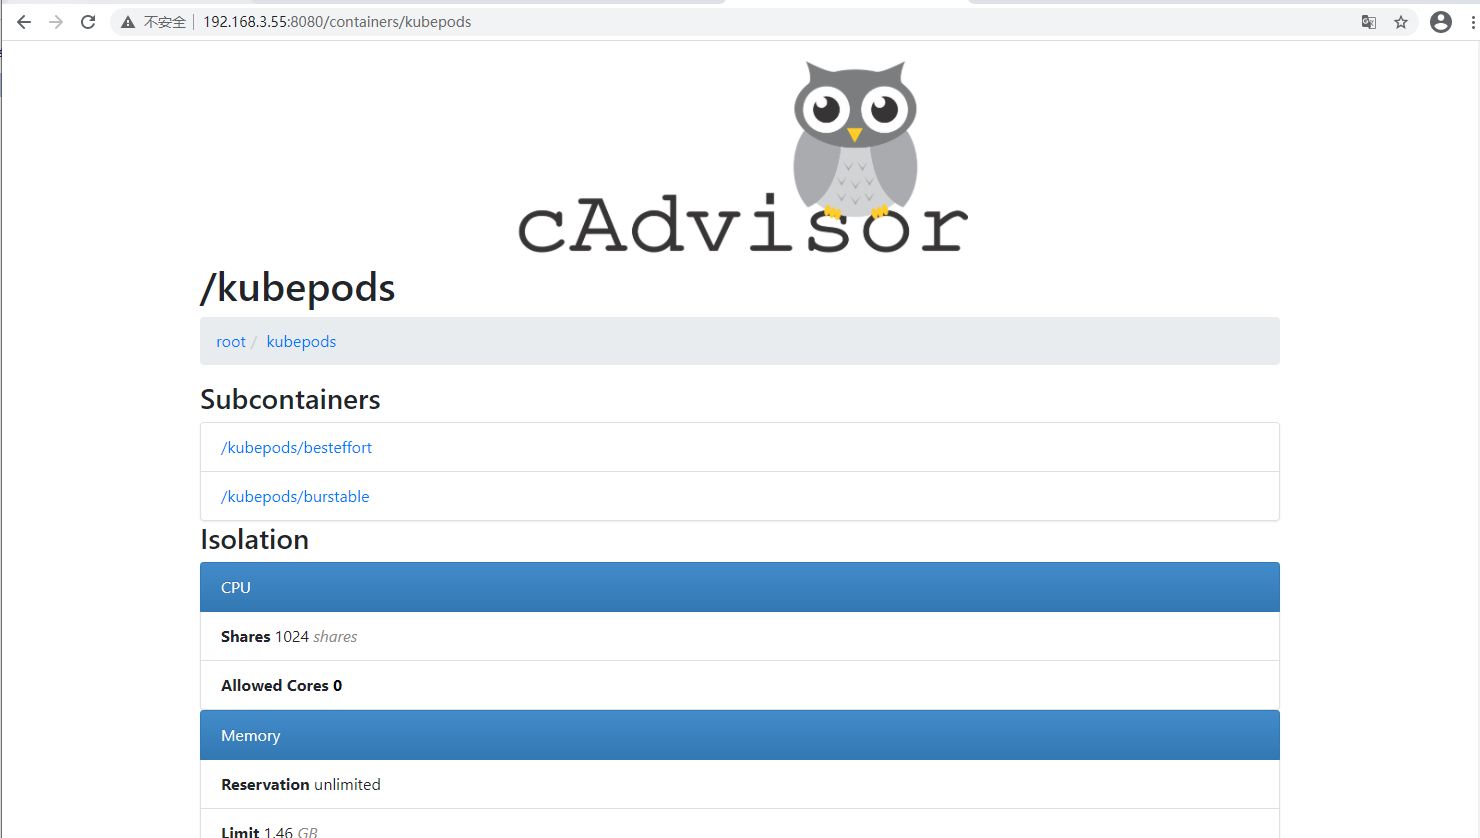
http://192.168.3.55:8080/ 访问cadvisor监控容器数据是否正常
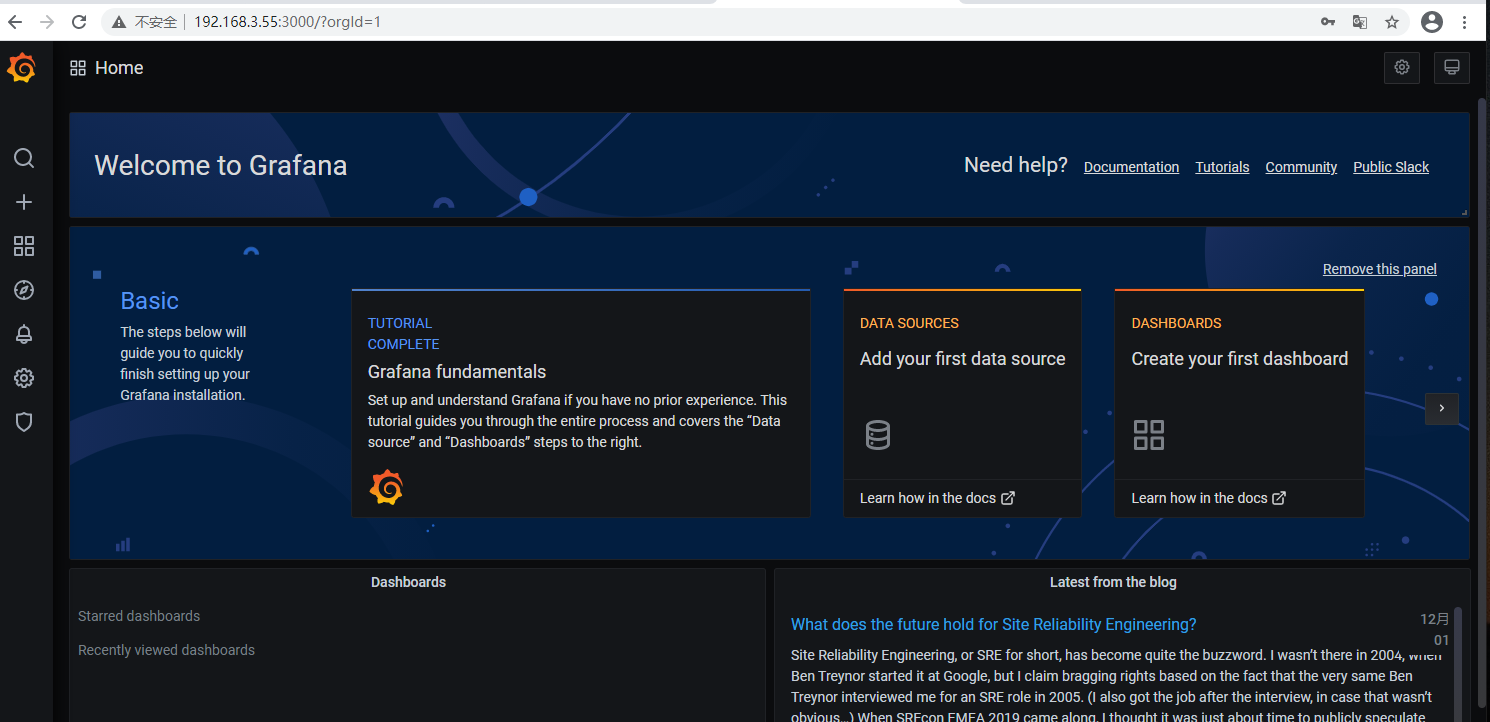
访问grafana(http://192.168.3.55:3000/)默认账号为admin密码我们在配置文件写的为123.com
学会放弃比坚持容易的多,但还没听过放弃也有收获。年轻人加油!!!

 浙公网安备 33010602011771号