scikit-learn 实现一个决策树模型
介绍:借助 scikit-learn 库,用 iris 数据集中的花瓣数据和类标数据训练一个决策树模型,可视化模型的决策边界和数据集中的样本。
1、定义可视化函数


import numpy as np
import matplotlib.pyplot as plt
from matplotlib.colors import ListedColormap

def plot_decision_regions(X, y, classifier, test_idx=None, resolution=0.02):

    # 定义颜色和标记符号,通过颜色列图表生成颜色示例图
    marker = ('o', 'x', 's', 'v', '^')
    colors = ('lightgreen', 'blue', 'red', 'cyan', 'gray')
    cmap = ListedColormap(colors[:len(np.unique(y))])

    # 可视化决策边界
    x1_min, x1_max = X[:, 0].min() - 1, X[:, 0].max() + 1
    x2_min, x2_max = X[:, 1].min() - 1, X[:, 1].max() + 1
    xx1, xx2 = np.meshgrid(np.arange(x1_min, x1_max, resolution),
                           np.arange(x2_min, x2_max, resolution))
    Z = classifier.predict(np.array([xx1.ravel(), xx2.ravel()]).T)
    Z = Z.reshape(xx1.shape)

    plt.contourf(xx1, xx2, Z, alpha=0.4, cmap=cmap)
    plt.xlim(xx1.min(), xx1.max())
    plt.ylim(xx2.min(), xx2.max())

    # 绘制所有的样本点
    for idx, cl in enumerate(np.unique(y)):
        plt.scatter(x=X[y == cl, 0], y=X[y == cl, 1], alpha=0.8,
                    c=cmap(idx), marker=marker[idx], s=73, label=cl)

    # 使用小圆圈高亮显示测试集的样本
    if test_idx:
        X_test, y_test = X[test_idx, :], y[test_idx]
        plt.scatter(X_test[:, 0], X_test[:, 1], c='', alpha=1.0, linewidth=1,
                    edgecolors='black', marker='o', s=135, label='test set')
2、准备数据
from sklearn import datasets
from sklearn.model_selection import train_test_split
from sklearn.preprocessing import StandardScaler

iris = datasets.load_iris()
X = iris.data[:, [2, 3]]
y = iris.target

# 划分测试集和训练集
X_train, X_test, y_train, y_test = train_test_split(
            X, y, test_size=0.3, random_state=0)
3、训练决策树模型,可视化图形
from sklearn.tree import DecisionTreeClassifier

%matplotlib inline
plt.rcParams['font.sans-serif'] = 'SimHei'
plt.rcParams['axes.unicode_minus'] = False

tree = DecisionTreeClassifier(criterion='entropy', max_depth=3, random_state=0)
tree.fit(X_train, y_train)

X_combined = np.vstack((X_train, X_test))
y_combined = np.hstack((y_train, y_test))

plt.figure(figsize=(11, 7))
plot_decision_regions(X_combined, y_combined, classifier=tree,
                      test_idx=range(105, 150))
plt.title('决策数模型的决策边界', fontsize=18, color='w')
plt.xlabel('花瓣长度(cm)', fontsize=15 )
plt.ylabel('花瓣宽度(cm)', fontsize=15 )
plt.legend(loc=2, scatterpoints=2, markerfirst=True, edgecolor='k', title='图例')
图形如下:
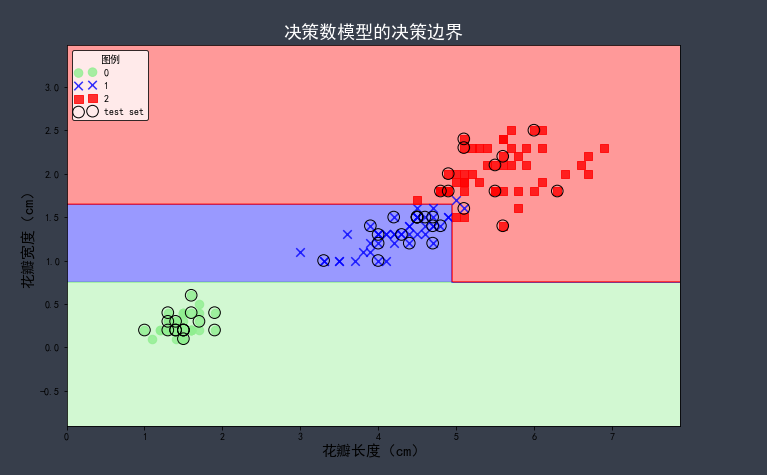
由图可知,训练得到的决策树模型下训练数据集上表现的很好,在测试数据集上的分类错误一个。
非学无以广才,非志无以成学。

 浙公网安备 33010602011771号