用核 SVM 划分有随机噪声得到的“异或”数据
1、用 NumPy 中的 logical_xor() 函数创建一个二维的“异或”数据集
import numpy as np
import matplotlib.pyplot as plt

np.random.seed(0)
X_xor = np.random.normal(0, 1, (300, 2))
y_xor = np.logical_xor(X_xor[:, 0] > 0 , X_xor[:, 1] > 0)
y_xor = np.where(y_xor, 1, -1)
2、导入 scikit-learn 库中的 SVM 类,用“异或”数据集训练一个核 SVM 模型,用核 SVM 通过一个非线性决策边界对“异或”数进行划分。
from sklearn.svm import SVC
import matplotlib.pyplot as plt

svm = SVC(kernel='rbf', random_state=0, gamma=0.10, C=10.0)
svm.fit(X_xor, y_xor)

plt.figure(figsize=(11, 7))
plot_decision_regions(X_xor, y_xor, classifier=svm)
plt.legend(scatterpoints=2)
图形如下:
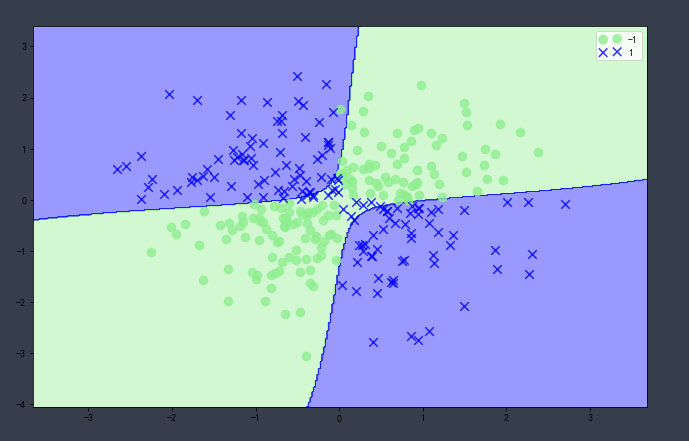
如图形所示,核 SVM 可以相对较好地划分“异或”数据。
非学无以广才,非志无以成学。

 浙公网安备 33010602011771号