J-Link GDB Server Command
J-Link GDB Server - SEGGER
Hilden, Germany – September 15th, 2011 – SEGGER Microcontroller today announced the free
availability of the J-Link GDB-Server. As the GNU-tool-chain gains ground in terms of performance and usability, GDB continues to grow in popularity. Per the numerous requests of this expanding community, SEGGER is now offering their professionally developed GDB-Server for free to all users of the SEGGER J-Link product line. The free GDB-server is now available for download as part of the J-Link Software and Documentation pack V4.35e.
“With the now free GDB-Server the GNU community has easier access to the fastest debug emulator in the market. For an unlimited debug experience we also offer Flash Breakpoints. This option is included in our non-commercial J-Link EDU, which is especially attractive to educational institutions”, says Dirk Akemann, Partnership Marketing Manager at SEGGER.
Full product specifications are available at: www.segger.com/jlink.html
The J-Link-Software is available at: www.segger.com/download_jlink.html.
J-Link GDB Server
The J-Link GDB Server is a remote server for the GDB which allows to use J-Link with GDB or any toolchain which uses GDB as debugging interface, such as Yagarto and Sourcery G++). The GDB and GDB Server communicate via a TCP/IP connection, using the standard GDB remote serial protocol. The GDB supports a standard set of commands like open elf/bin files, reading/writing memory, etc. Beside this, the GDB also supports so called monitor commands which are passed to the GDB Server and interpreted by it, allowing it to implement J-Link specific commands like reading/writing CP15 registers, enabling flash download via J-Link, using Unlimited Flash Breakpoints, enabling semihosting, etc. In general, the J-Link software and documentation package comes with two versions of the GDB Server: A GUI based one and a command-line version.
GNU Project Debugger (GDB) overview
The GNU Project Debugger (GDB) is a freely available debugger, distributed under the terms of the GNU Public license (GPL). It connects to an emulator via a TCP/IP connection. It can connect to every emulator for which a GDB server software is available. The latest Unix version of the GDB is freely available from the GNU committee under: http://www.gnu.org/software/gdb/download/
Supported cores
Currently, the J-Link GDB Server can be used with the following CPU cores:
- ARM7/9/11
- Cortex-A5/A8/A9
- Cortex-M0/M0+/M1/M3/M4/M7
- Cortex-R4
- Microchip PIC32
- Renesas RX610, RX621, RX62N, RX62T, RX630, RX631, RX63N
Availability
J-Link GDB Server comes with cross-platform support and is available for Windows, Linux and Mac OS X.
Requirements
To use the J-Link GDB Server, you have to meet the following requirements:
- J-Link / J-Trace ARM / J-Trace for Cortex-M
- Target hardware with supported CPU
J-Link GDB Server (GUI Version)
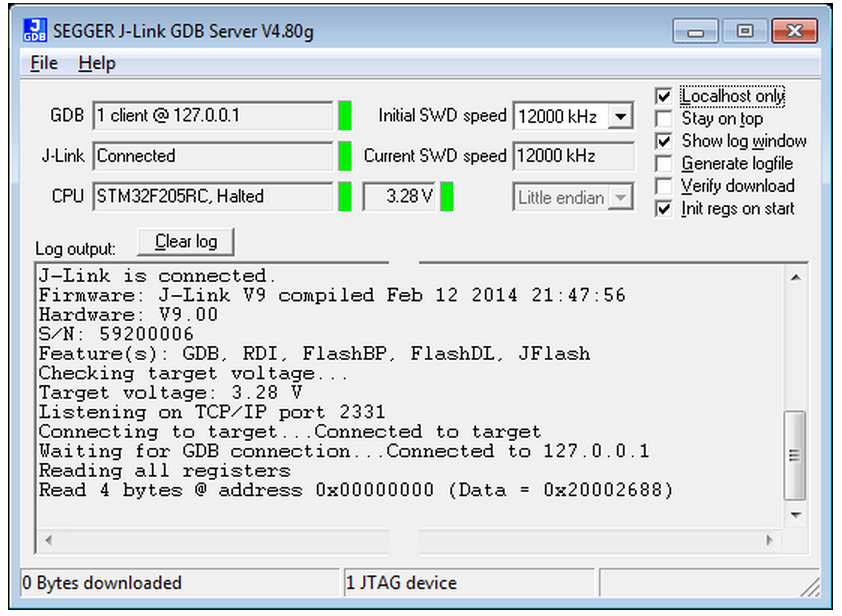
The J-Link GDB Server's user interface shows information about the debugging process and allows the user to configure some settings like target endianess, if memory reads should be cached in order to improve performance or if a logfile shall be generated.
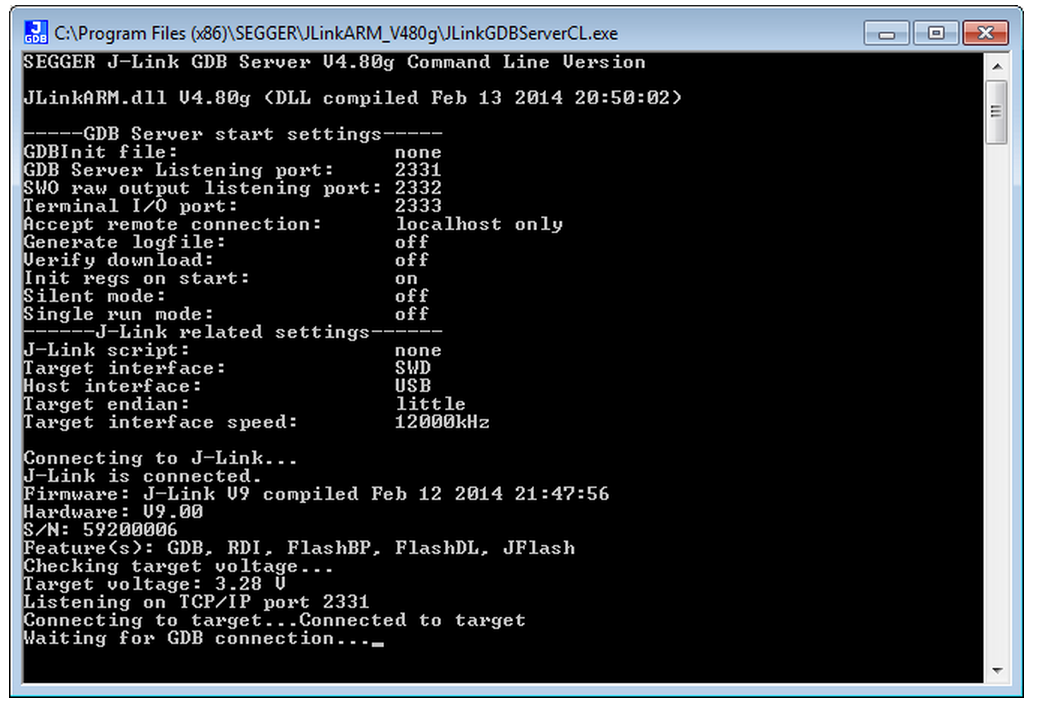
J-Link GDB Server (Command Line Version)
The command line version of J-Link GDB Server is a special version of the J-Link GDB Server which does not provide any GUI interface and has been especially developed for J-Link Linux & MAC support. It basically provides the same features as the GUI Version of J-Link GDB Server. The command line version of the J-Link GDB Server is also available for Windows and comes with the regular J-Link software and documentation package.
Setting up the J-Link GDB Server
Typically, most of the GDB and target setup is done from GDB via remote commands (monitor) in the .gdbinit file. The commands used in the .gdbinit file are performed before the download of the application into the target memory is performed. This allows the user to perform initialization steps which might be necessary to enable the access to the target memory. The .gdbinit file also allows to use download into flash memory via J-Link and Unlimited Flash Breakpoints. Nevertheless, some options need to be setup when starting the GDB Server (Target endianess, device name for devices which need a special connect sequence) since this information is needed to guarantee a proper target connection
Protocol extensions
- SWO support
GDB Server supports transfer of SWO data (terminal output, instrumentation trace, PC samples, etc.)
J-Link GDB Server
The GNU Project Debugger (GDB) is a freely available and open source debugger. It can be used in command line mode, but is also integrated in many IDEs like emIDE
or Eclipse.
J-Link GDB Server is a remote server for GDB making it possible for GDB to connect to and communicate with the target device via J-Link.
GDB Server and GDB communicate via a TCP/IP connection, using the standard GDB remote protocol. GDB Server receives the GDB commands, does the J-Link communication and replies with the answer to GDB.
With J-Link GDB Server debugging in ROM and Flash of the target device is possible and the Unlimited Flash Breakpoints can be used.
It also comes with some functionality not directly implemented in the GDB. These can be accessed via monitor commands, sent directly via GDB, too.
The GNU Project Debugger (GDB) is a freely available debugger, distributed under the terms of the GPL. The latest Unix version of the GDB is freely available from the
GNU committee under: http://www.gnu.org/software/gdb/download/
J-Link GDB Server is distributed free of charge.
Setting up GDB Server GUI version
The GUI version of GDB Server is part of the Windows J-Link Software Package (JLinkGDBServer.exe).
When starting GDB Server a configuration dialog pops up letting you select the needed configurations to connect to J-Link and the target.
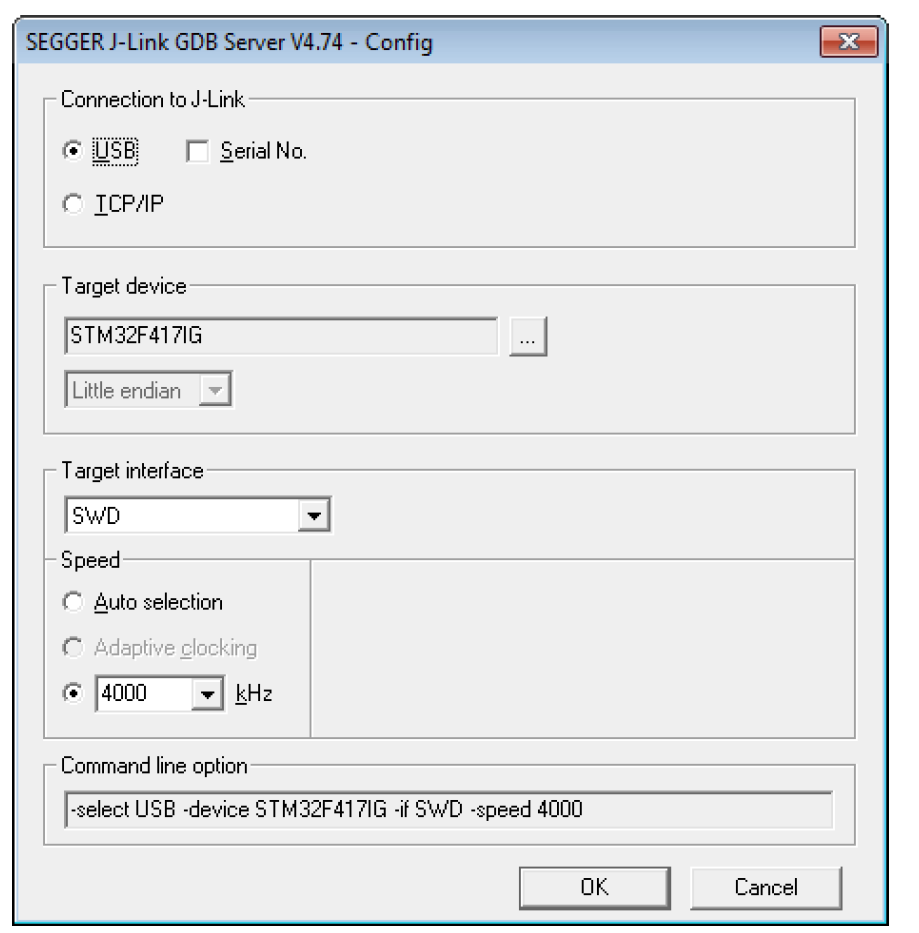
All configurations can optionally be given in the command line options.
Note:
To make sure the connection to the target device can be established corretly, the device, as well as the interface and interface speed have to be given on
start of GDB Server, either via command line options or the configuration dialog. If the target device option (-device) is given, the configuration dialog will not pop up.
GDB Server user interface
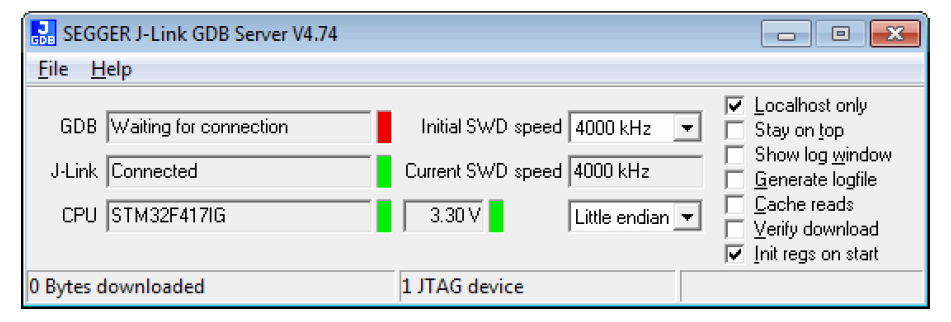
The J-Link GDB Servers user interface shows information about the debugging process and the target and allows to configure some settings during execution.
It shows following information:
- The IP address of host running debugger.
- Connection status of J-Link.
- Information about the target core.
- Measured target voltage.
- Bytes that have been downloaded.
- Status of target.
- Log output of the GDB Server (optional, if Show log window is checked).
- Initial and current target interface speed.
- Target endianess.
These configurations can be made from inside GDB Server:
- Localhost only: If checked only connections from 127.0.0.1 are accepted.
- Stay on top
- Show log window.
- Generate logfile: If checked, a log file with the GDB <-> GDB Server <-> J-Link communication will be created.
- Verify download: If checked, the memory on the target will be verified afterdownload.
- Init regs on start: If checked, the register values of the target will be set to a reasonable value before on start of GDB Server.
Supported remote (monitor) commands
J-Link GDB Server comes with some functionalities which are not part of the standard GDB.
These functions can be called either via a gdbinit file passed to GDB Server or via monitor commands passed directly to GDB, forwarding them to GDB Server.
To indicate to GDB to forward the command to GDB Server ’monitor’ has to be prepended to the call.
For example a reset can be triggered in the gdbinit file with "reset" or via GDB with "monitor reset".
Following remote commands are available:

Following remote commands are deprecated and only available for backward compability:
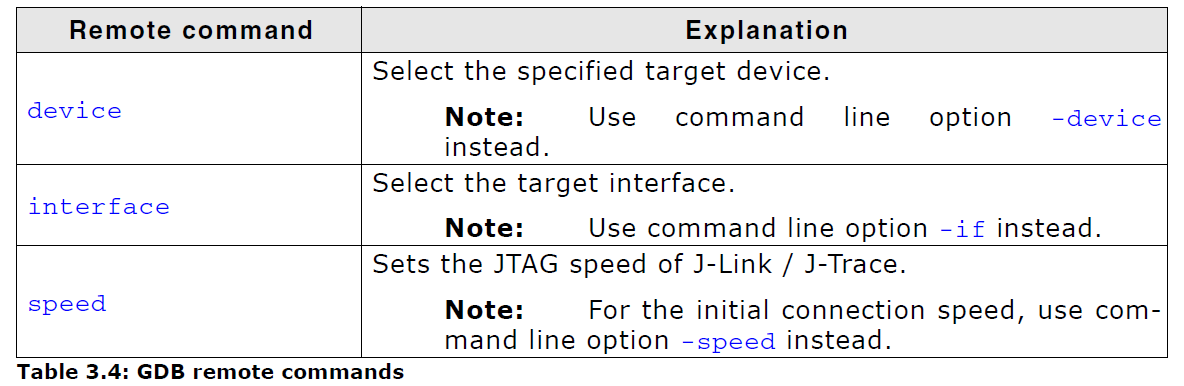
Note: The remote commands are case-insensitive.
Note: Optional parameters are set into square brackets.
Note: The examples are described as follows:
- Lines starting with ’#’ are comments and not used in GDB / GDB Server.
- Lines starting with ’>’ are input commands from the GDB.
- Lines starting with ’<’ is the output from GDB Server as printed in GDB.

 浙公网安备 33010602011771号