
【R语言】二图叠加
使用par(new=TRUE)将第二章图叠加到第一张图上
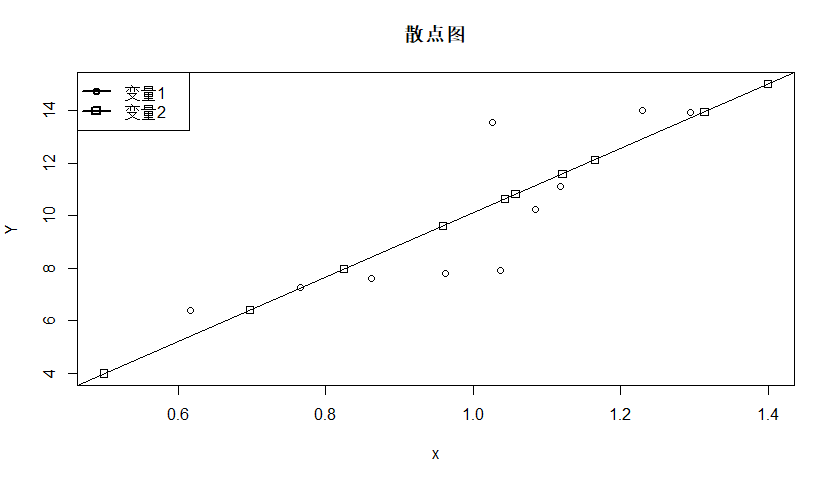
x = c(0.617, 0.766, 0.862, 0.963, 1.037, 1.026, 1.085, 1.118, 1.23, 1.295)
y = c(6.393, 7.277, 7.63, 7.791, 7.906, 13.557, 10.221, 11.103, 14.018, 13.913)
yi = c(5.336, 7.144, 8.308, 9.533, 10.431, 10.297, 11.013, 11.413, 12.772, 13.561)

plot(x, y, type="p", main="散点图", xlab="x", ylab="Y", ylim=c(4,15), xlim=c(0.5,1.4))

par(new=TRUE)#运行这个函数可以将第二章图叠加到第一张图上

plot(x, yi, type="p",pch =0,axes = FALSE,xlab=" ", ylab=" ",)#axes = FALSE,坐标轴不显示

abline(lm(y~x))#加线
legend("topleft", legend=c("变量1","变量2"),pch =c(1,0),lty=1,lwd=2)
结果:

 浙公网安备 33010602011771号