
mysql- 可视化监控-mysql_exportor+Prometheus+Grafana ,整体监控-03
一、搭建 可视化监控环境
前提条件: 环境已搭建好 Prometheus,Grafana,node_exporter
Prometheus 的安装参考:待补充
Grafana 的安装参考:待补充
node_exporter 安装参考:待补充
1.1 下载安装包:
https://github.com/prometheus/mysqld_exporter/releases
1.2 上传安装包到服务器
[root@demo demo]# cd /usr/local/
[root@demo local]# rz
1.3 解压安装包
[root@demo local]# tar -zxvf mysqld_exporter-0.12.1.linux-amd64.tar.gz
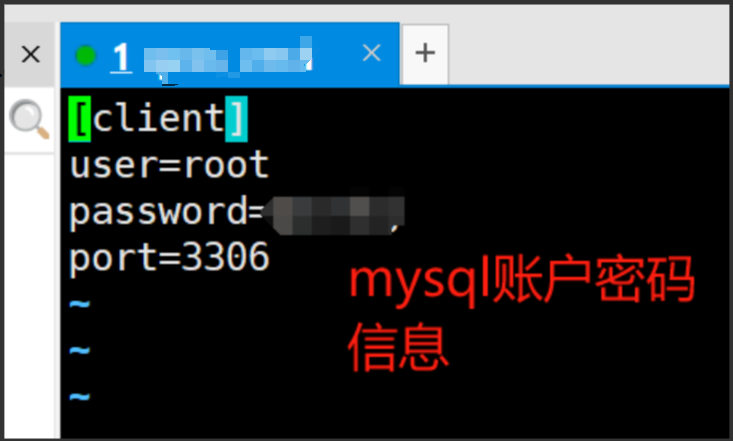
1.4 配置文件
[root@demo mysqld_exporter-0.12.1.linux-amd64]# pwd
/usr/local/mysqld_exporter-0.12.1.linux-amd64
[root@demo mysqld_exporter-0.12.1.linux-amd64]# vim .my.cnf
1.5 启动
[root@demo mysqld_exporter-0.12.1.linux-amd64]# ./mysqld_exporter --config.my-cnf=".my.cnf"
INFO[0000] Starting mysqld_exporter (version=0.12.1, branch=HEAD, revision=48667bf7c3b438b5e93b259f3d17b70a7c9aff96)  source="mysqld_exporter.go:257"
INFO[0000] Build context (go=go1.12.7, user=root@0b3e56a7bc0a, date=20190729-12:35:58)  source="mysqld_exporter.go:258"
INFO[0000] Enabled scrapers:                             source="mysqld_exporter.go:269"
INFO[0000]  --collect.global_status                      source="mysqld_exporter.go:273"
INFO[0000]  --collect.global_variables                   source="mysqld_exporter.go:273"
INFO[0000]  --collect.slave_status                       source="mysqld_exporter.go:273"
INFO[0000]  --collect.info_schema.innodb_cmp             source="mysqld_exporter.go:273"
INFO[0000]  --collect.info_schema.innodb_cmpmem          source="mysqld_exporter.go:273"
INFO[0000]  --collect.info_schema.query_response_time    source="mysqld_exporter.go:273"
INFO[0000] Listening on :9104                            source="mysqld_exporter.go:283"
^C
You have new mail in /var/spool/mail/root
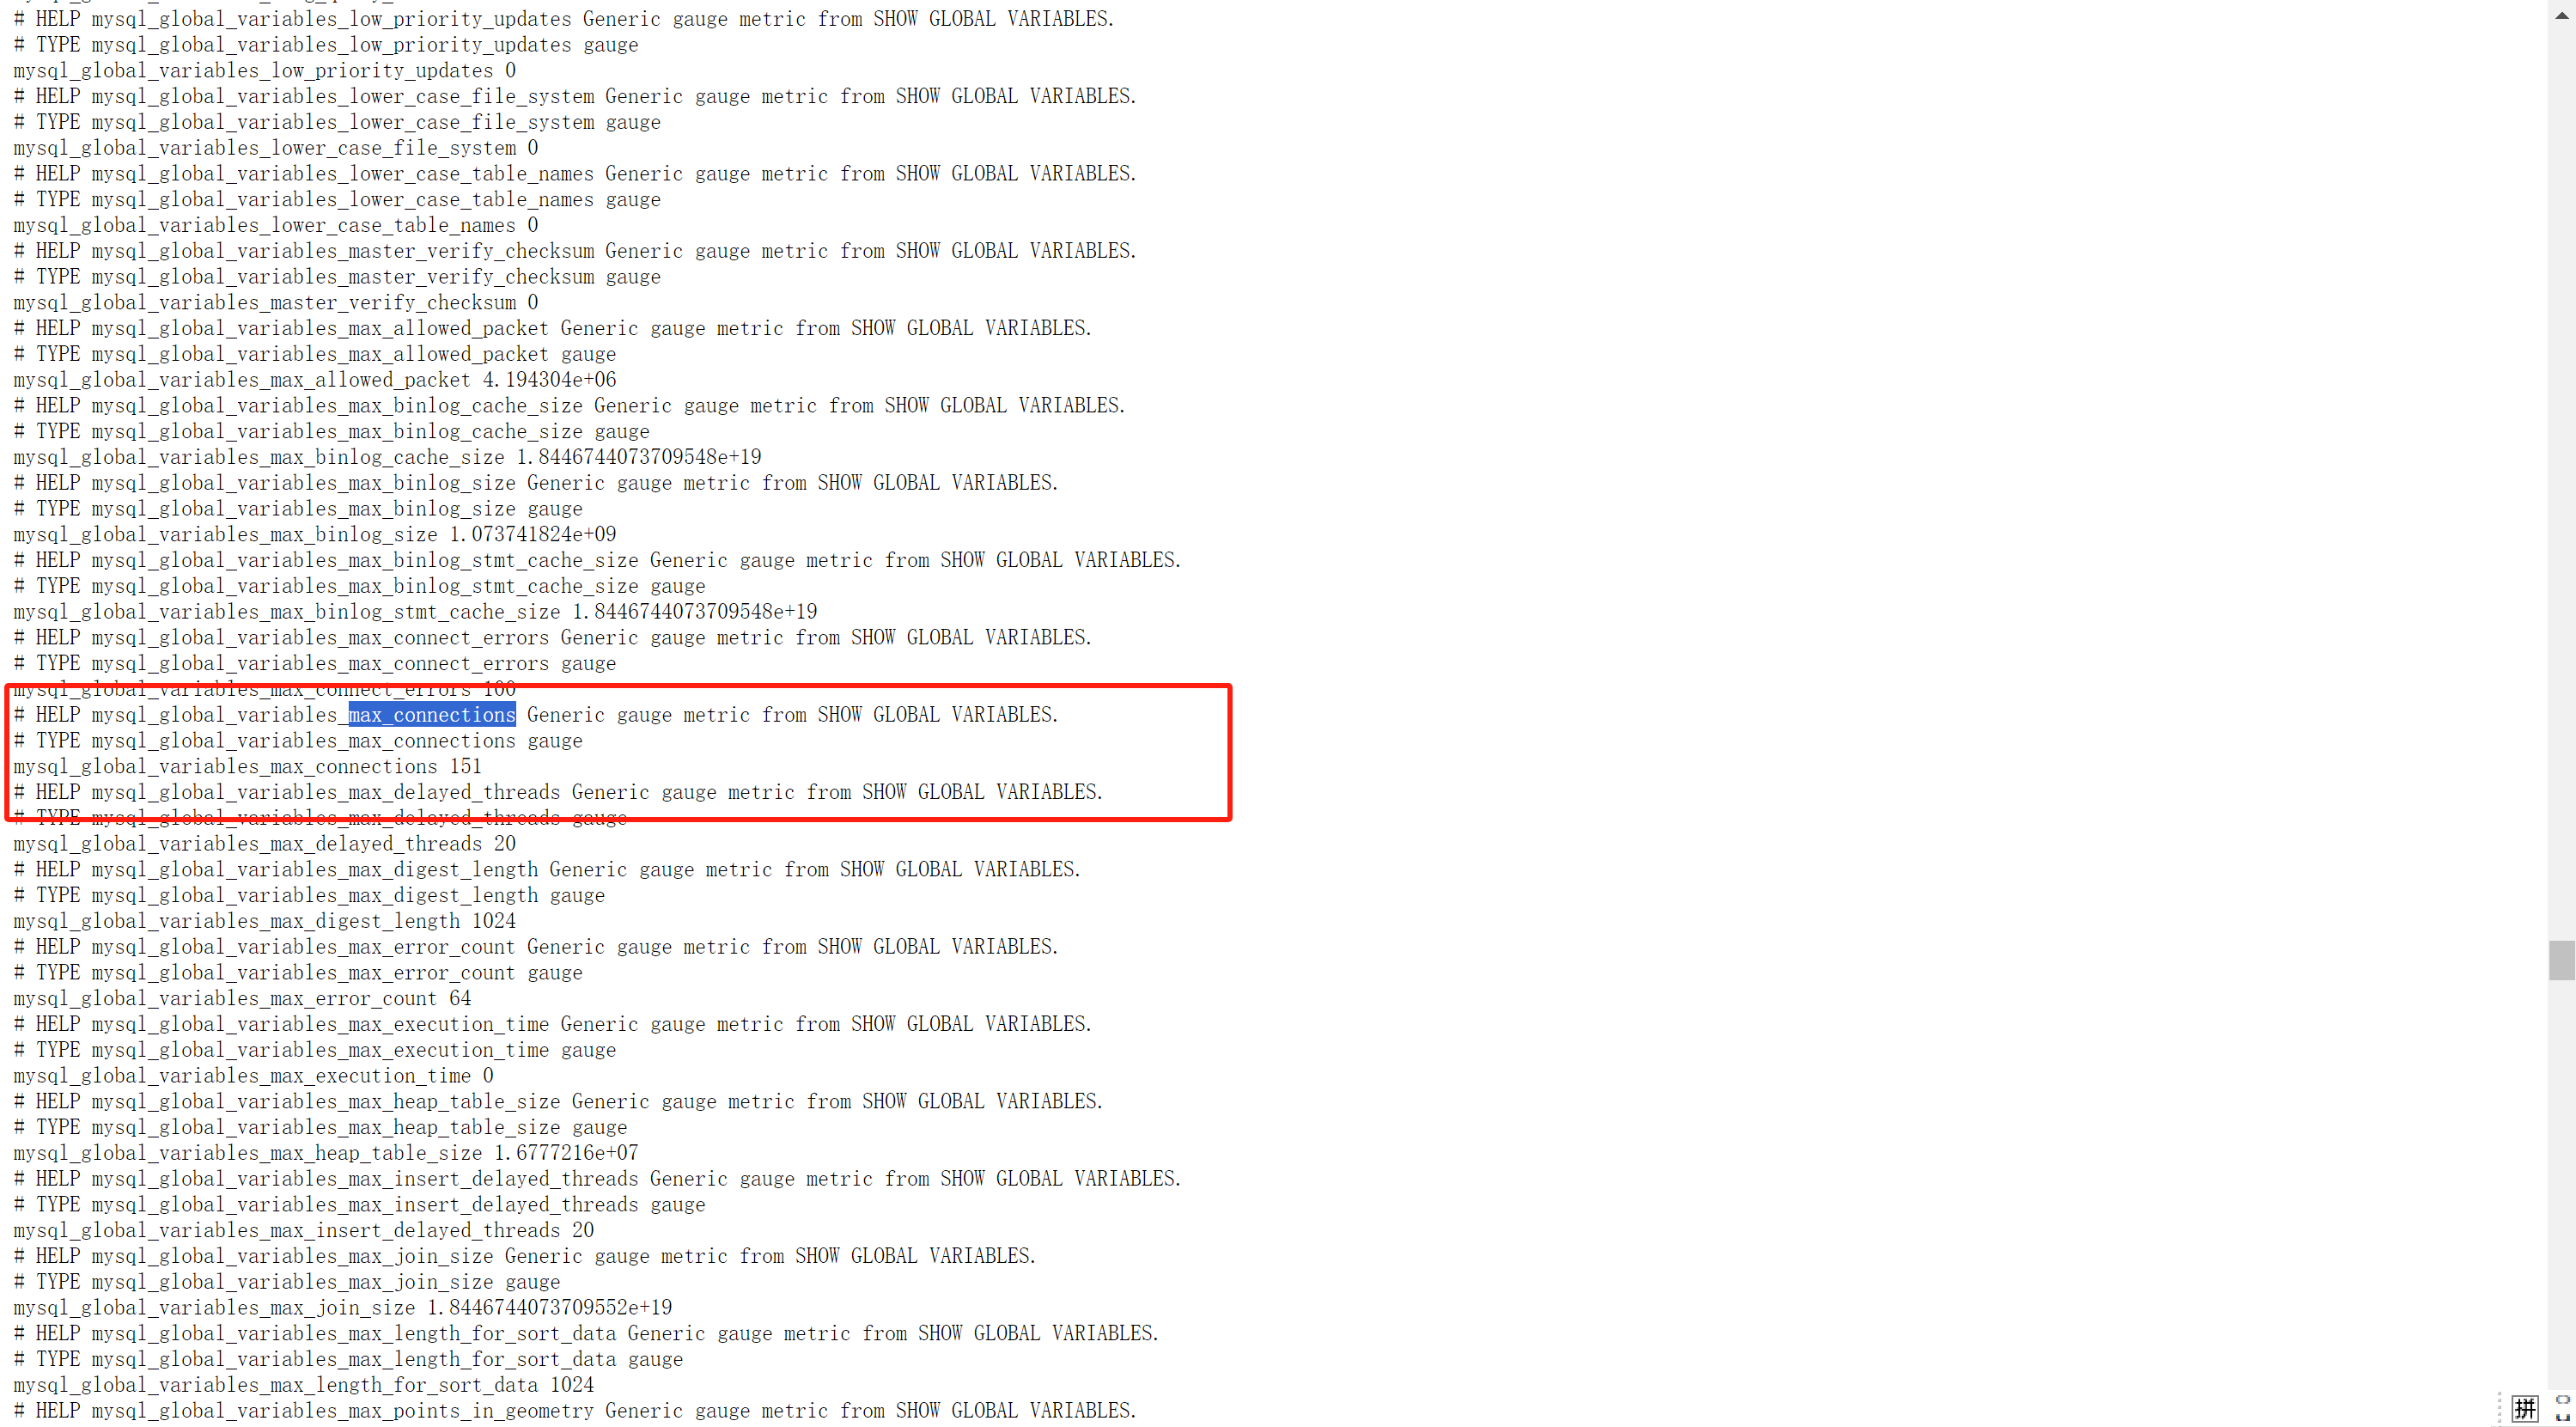
1.6 浏览器访问 http://ip:9104/ ,可以查看到信息,成功

二、进行Prometheus 配置
2.1 进入Prometheus 安装的服务器
[root@demo prometheus-2.19.1.linux-amd64]# pwd
/usr/local/prometheus-2.19.1.linux-amd64
2.2. 修改配置
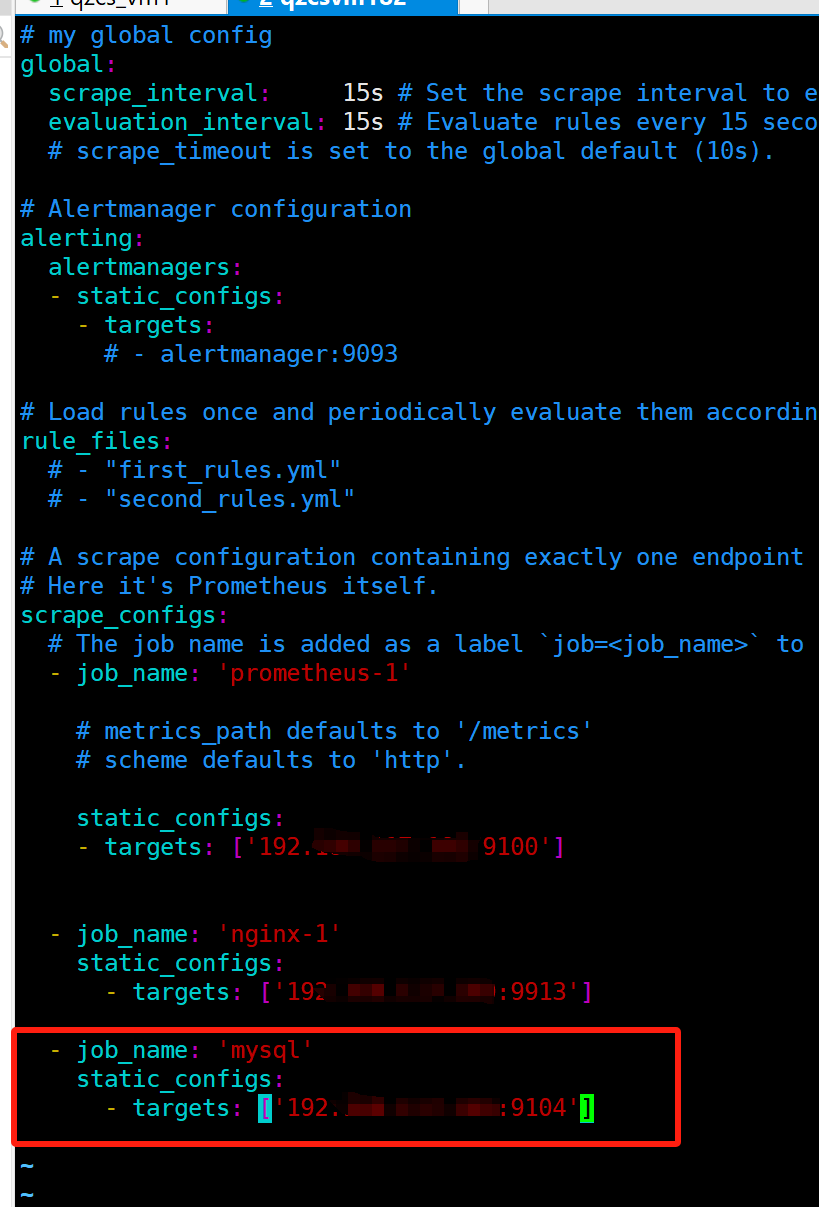
[root@demo prometheus-2.19.1.linux-amd64]# vim prometheus.yml
- job_name: 'mysql'
static_configs:
- targets: ['192.168.117.180:9104']
2.3 重启prometheus
nohup /usr/local/prometheus-2.19.1.linux-amd64/prometheus --config.file=/usr/local/prometheus-2.19.1.linux-amd64/prometheus.yml &
或者:systemctl restart prometheus
systemctl status prometheus
[root@demo prometheus-2.19.1.linux-amd64]# nohup /usr/local/prometheus-2.19.1.linux-amd64/prometheus --config.file=/usr/local/prometheus-2.19.1.linux-amd64/prometheus.yml &
[1] 4602
[root@demo prometheus-2.19.1.linux-amd64]# nohup: ignoring input and appending output to ‘nohup.out’

[1]+  Exit 1                  nohup /usr/local/prometheus-2.19.1.linux-amd64/prometheus --config.file=/usr/local/prometheus-2.19.1.linux-amd64/prometheus.yml
[root@demo prometheus-2.19.1.linux-amd64]#
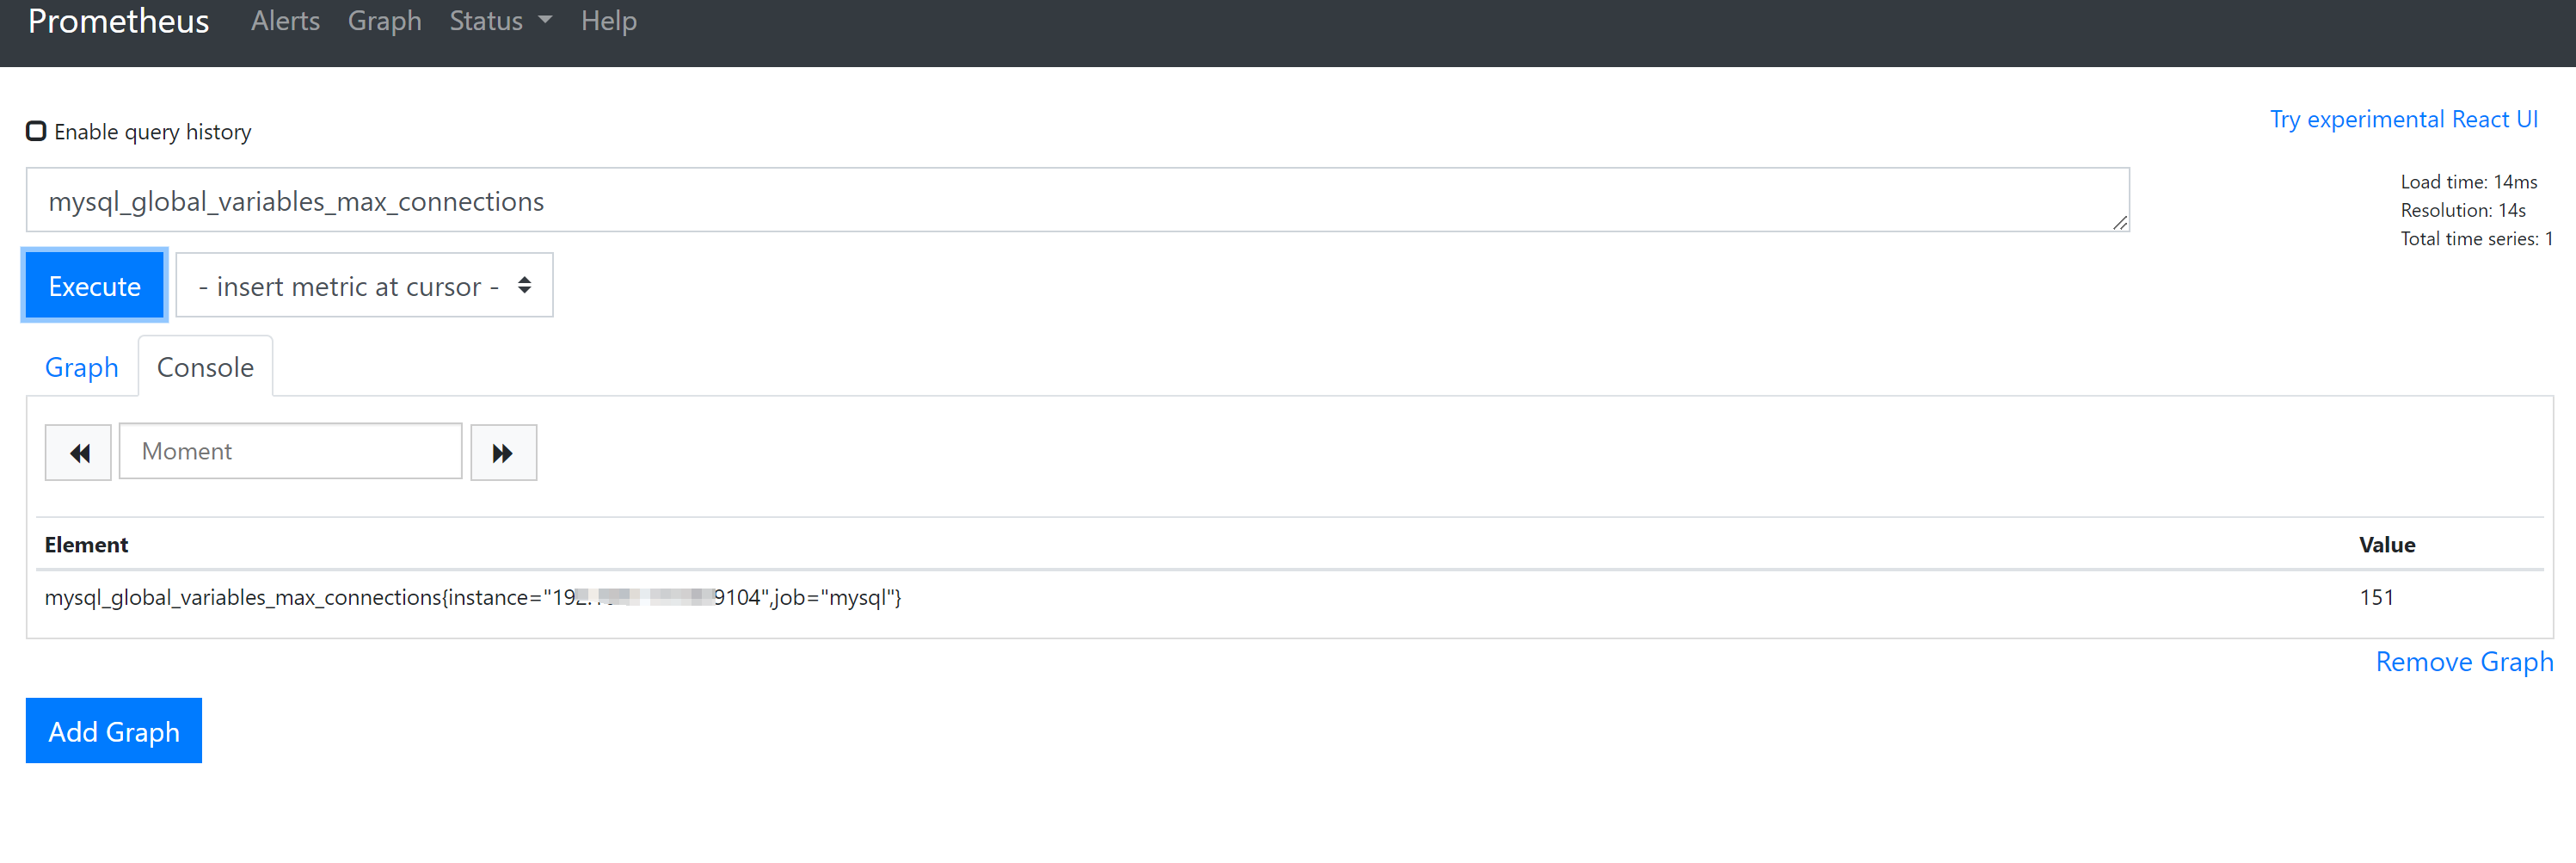
2.4 浏览器访问 http://ip:9090/graph
mysql_global_variables_max_connections
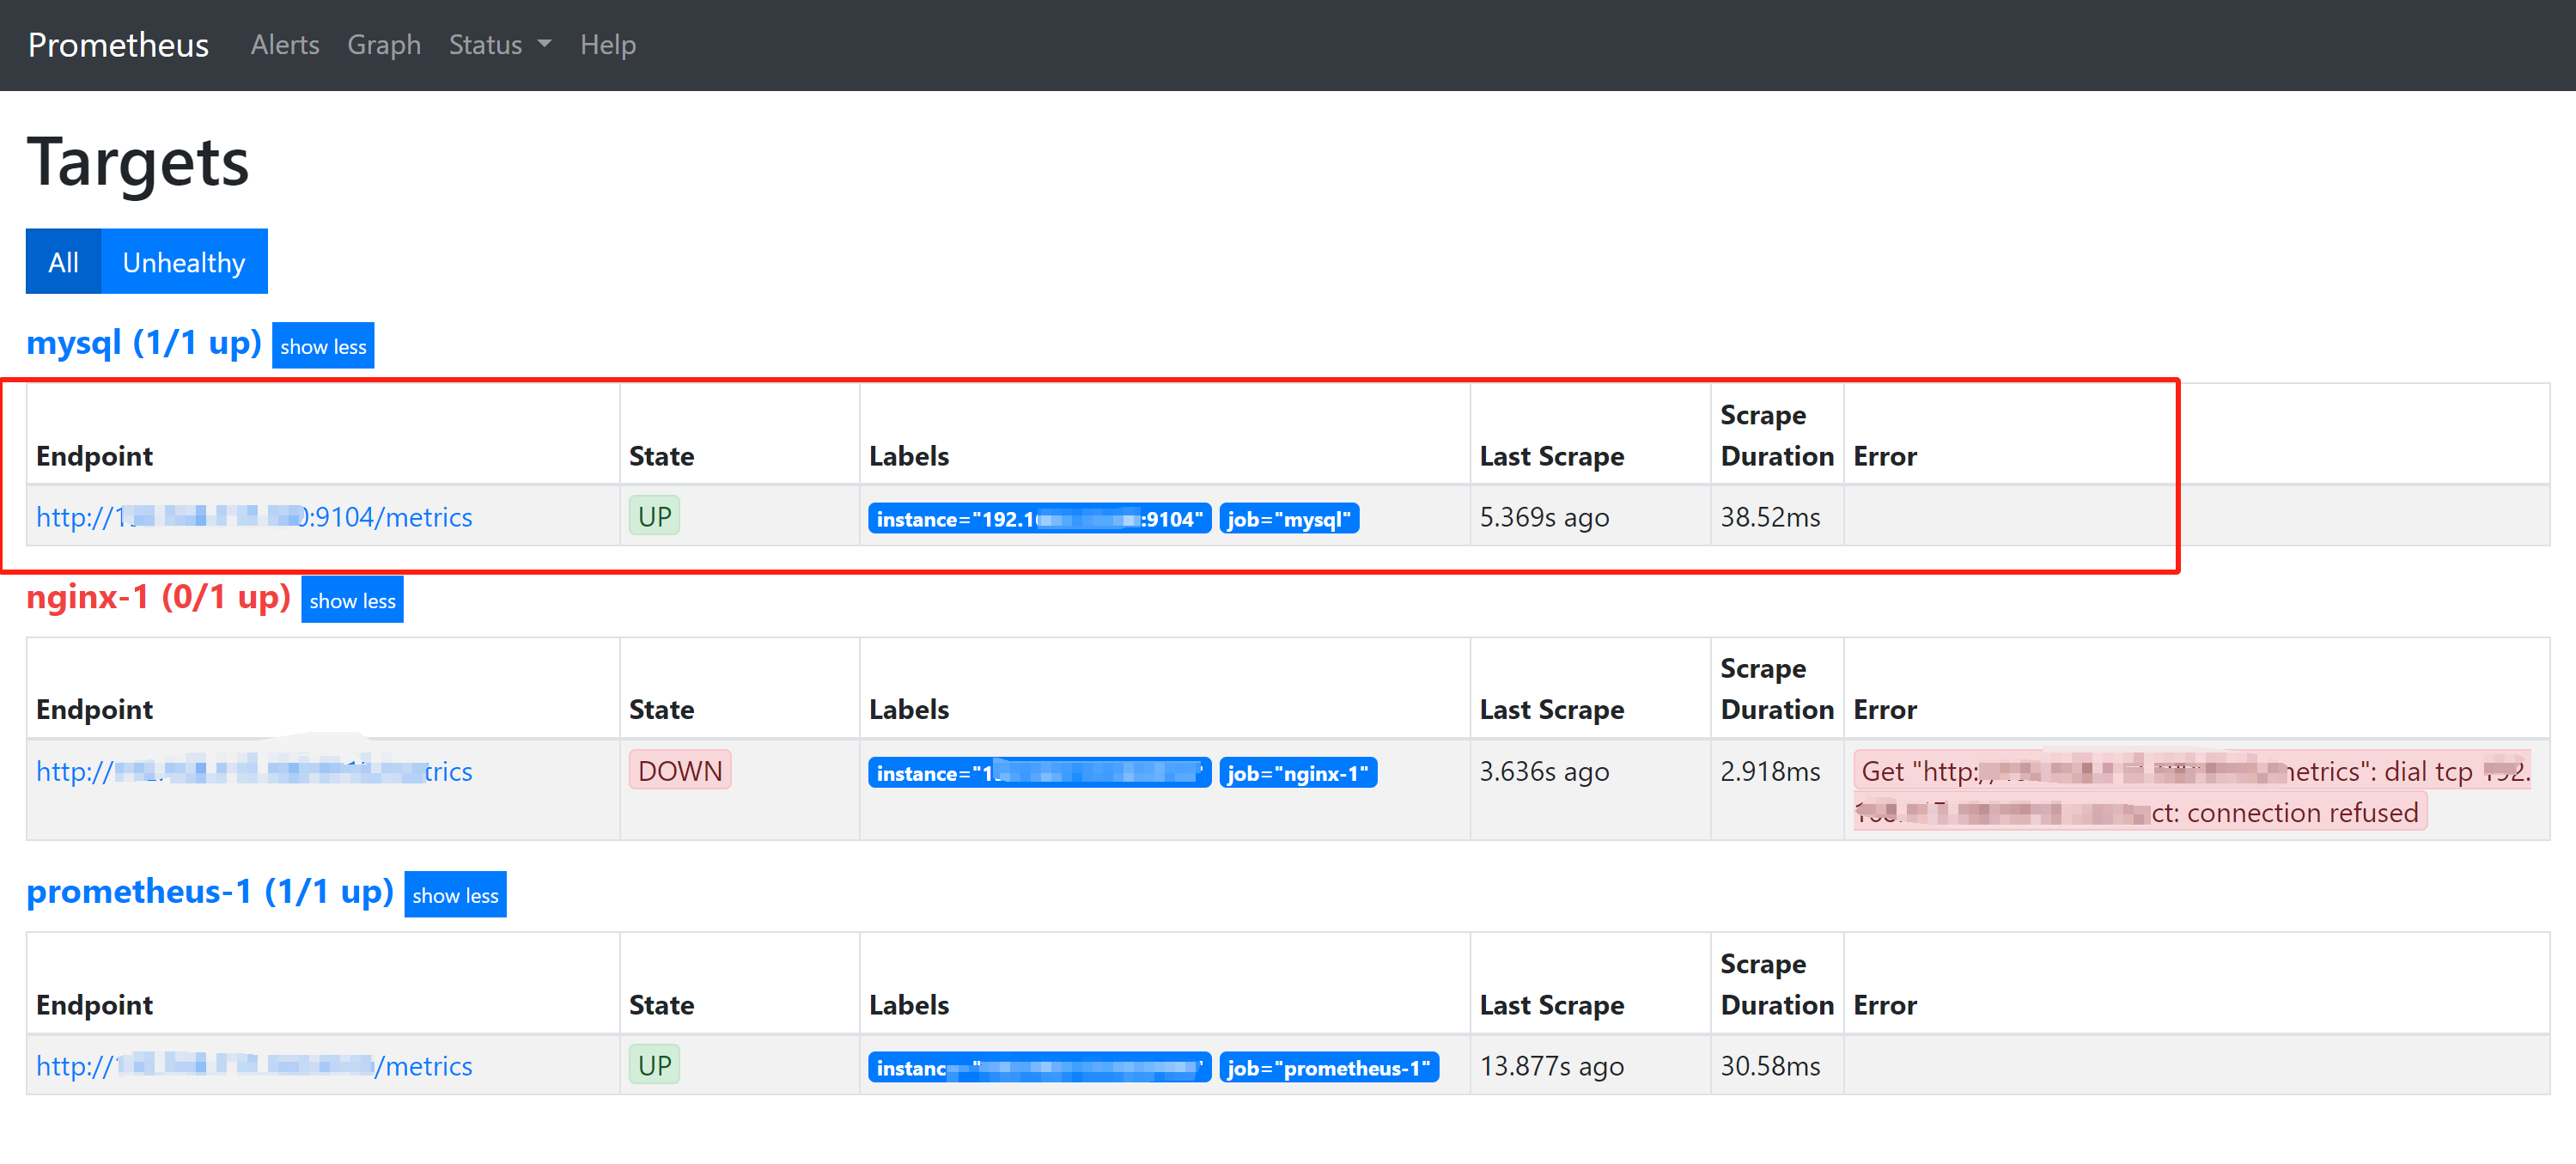
访问 http://ip :9090/targets
二、进行Grafana 配置
前提: Grafana 正常启动
1、 浏览器访问 http://ip:3000/login 输入账户密码

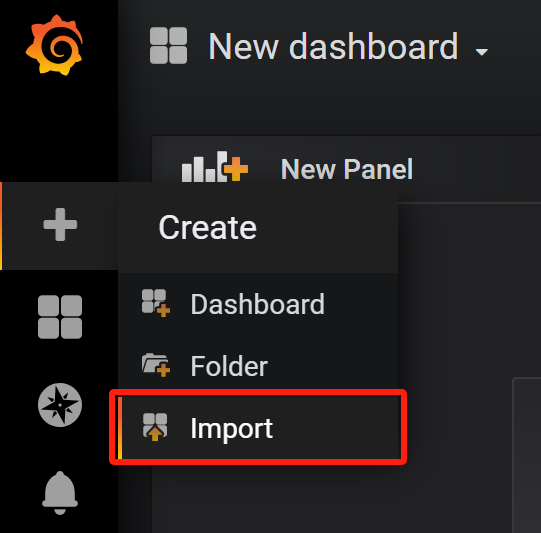
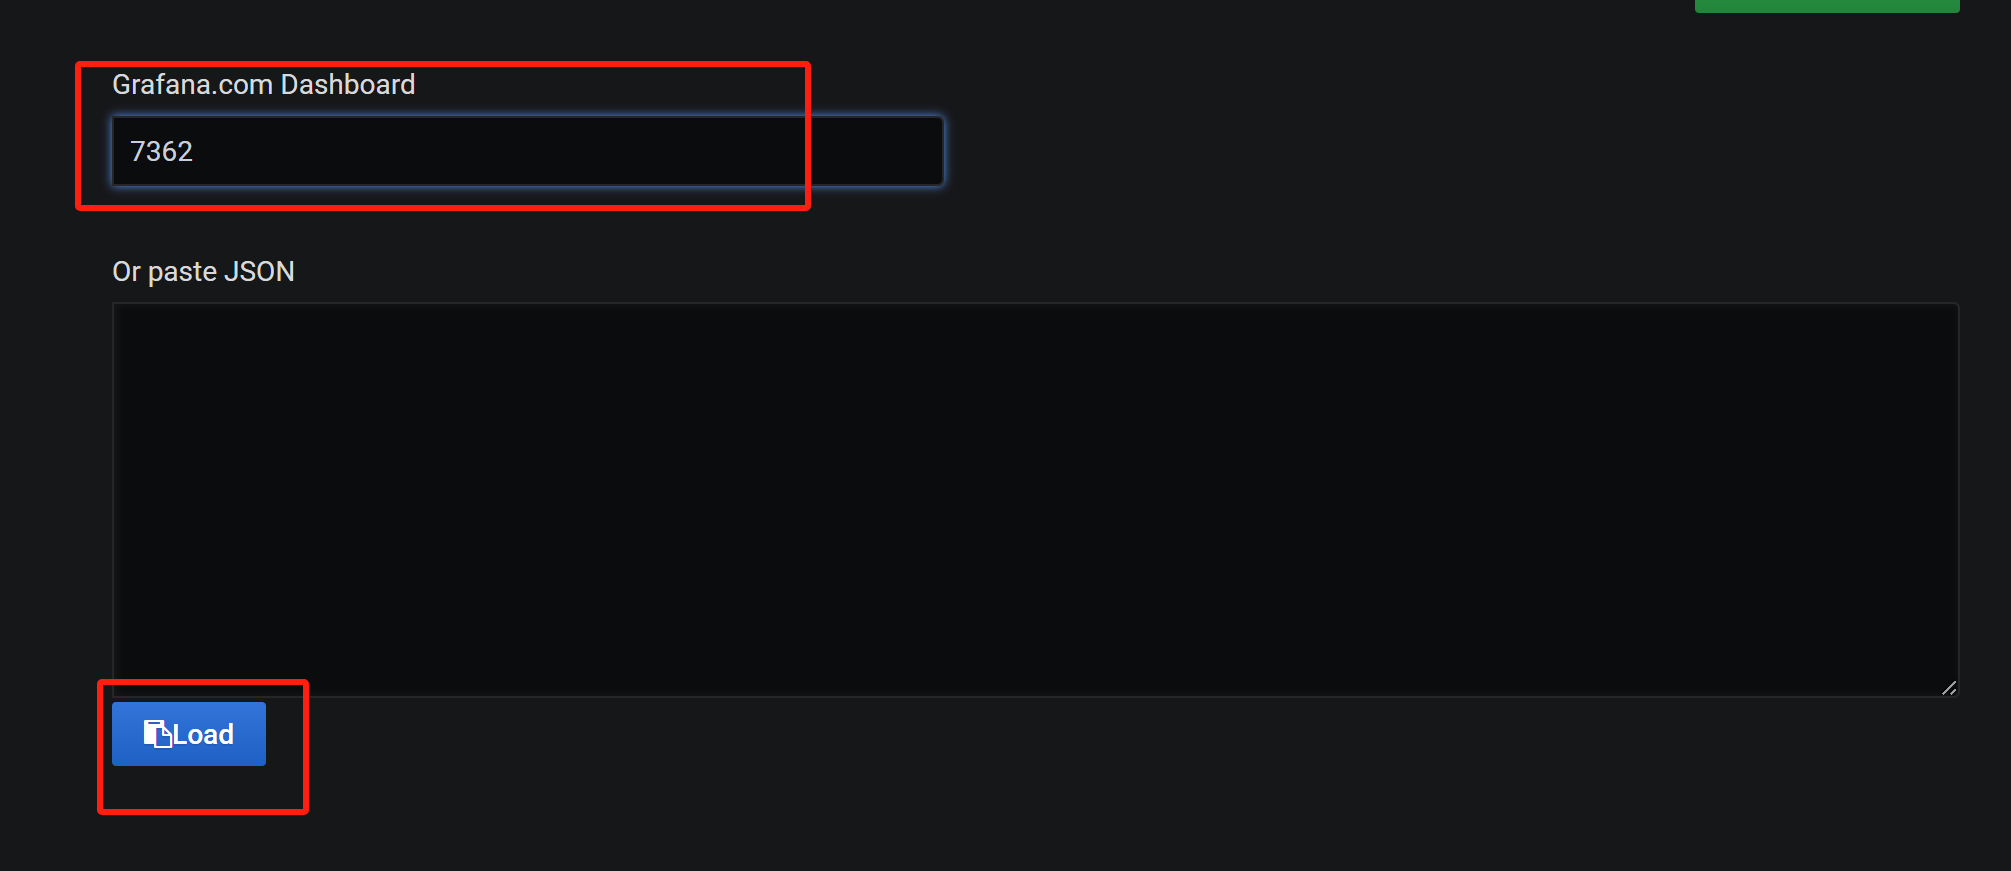
2、导入模板 7362
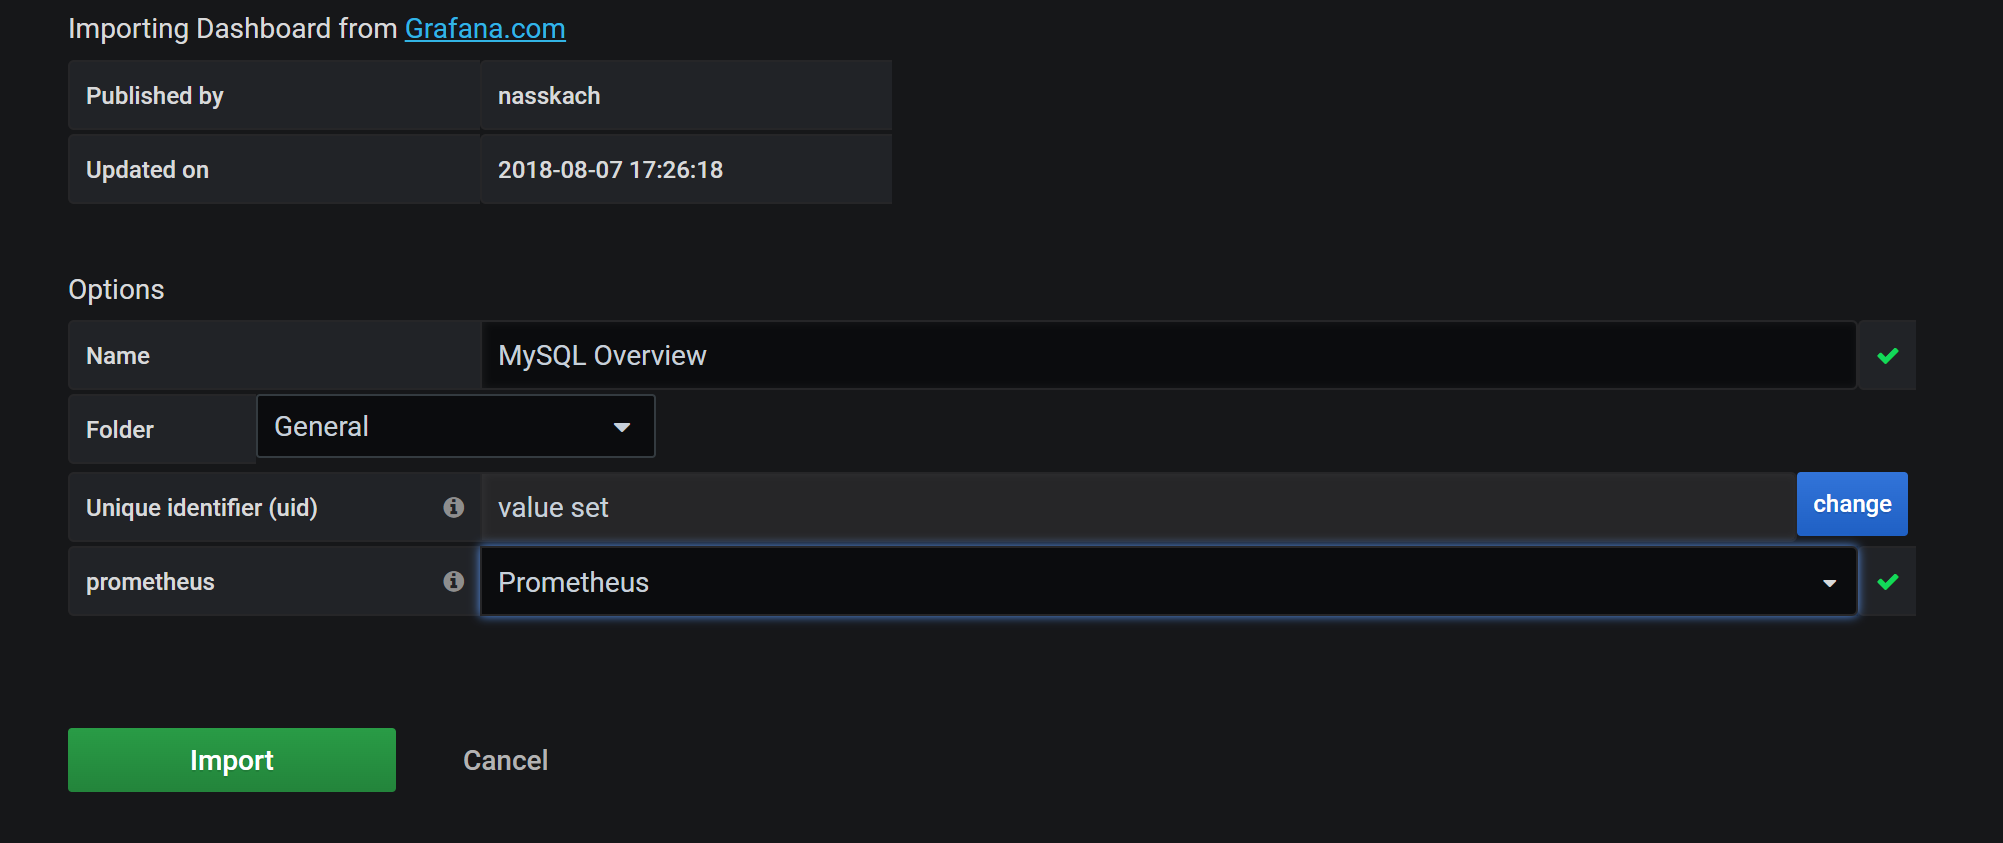
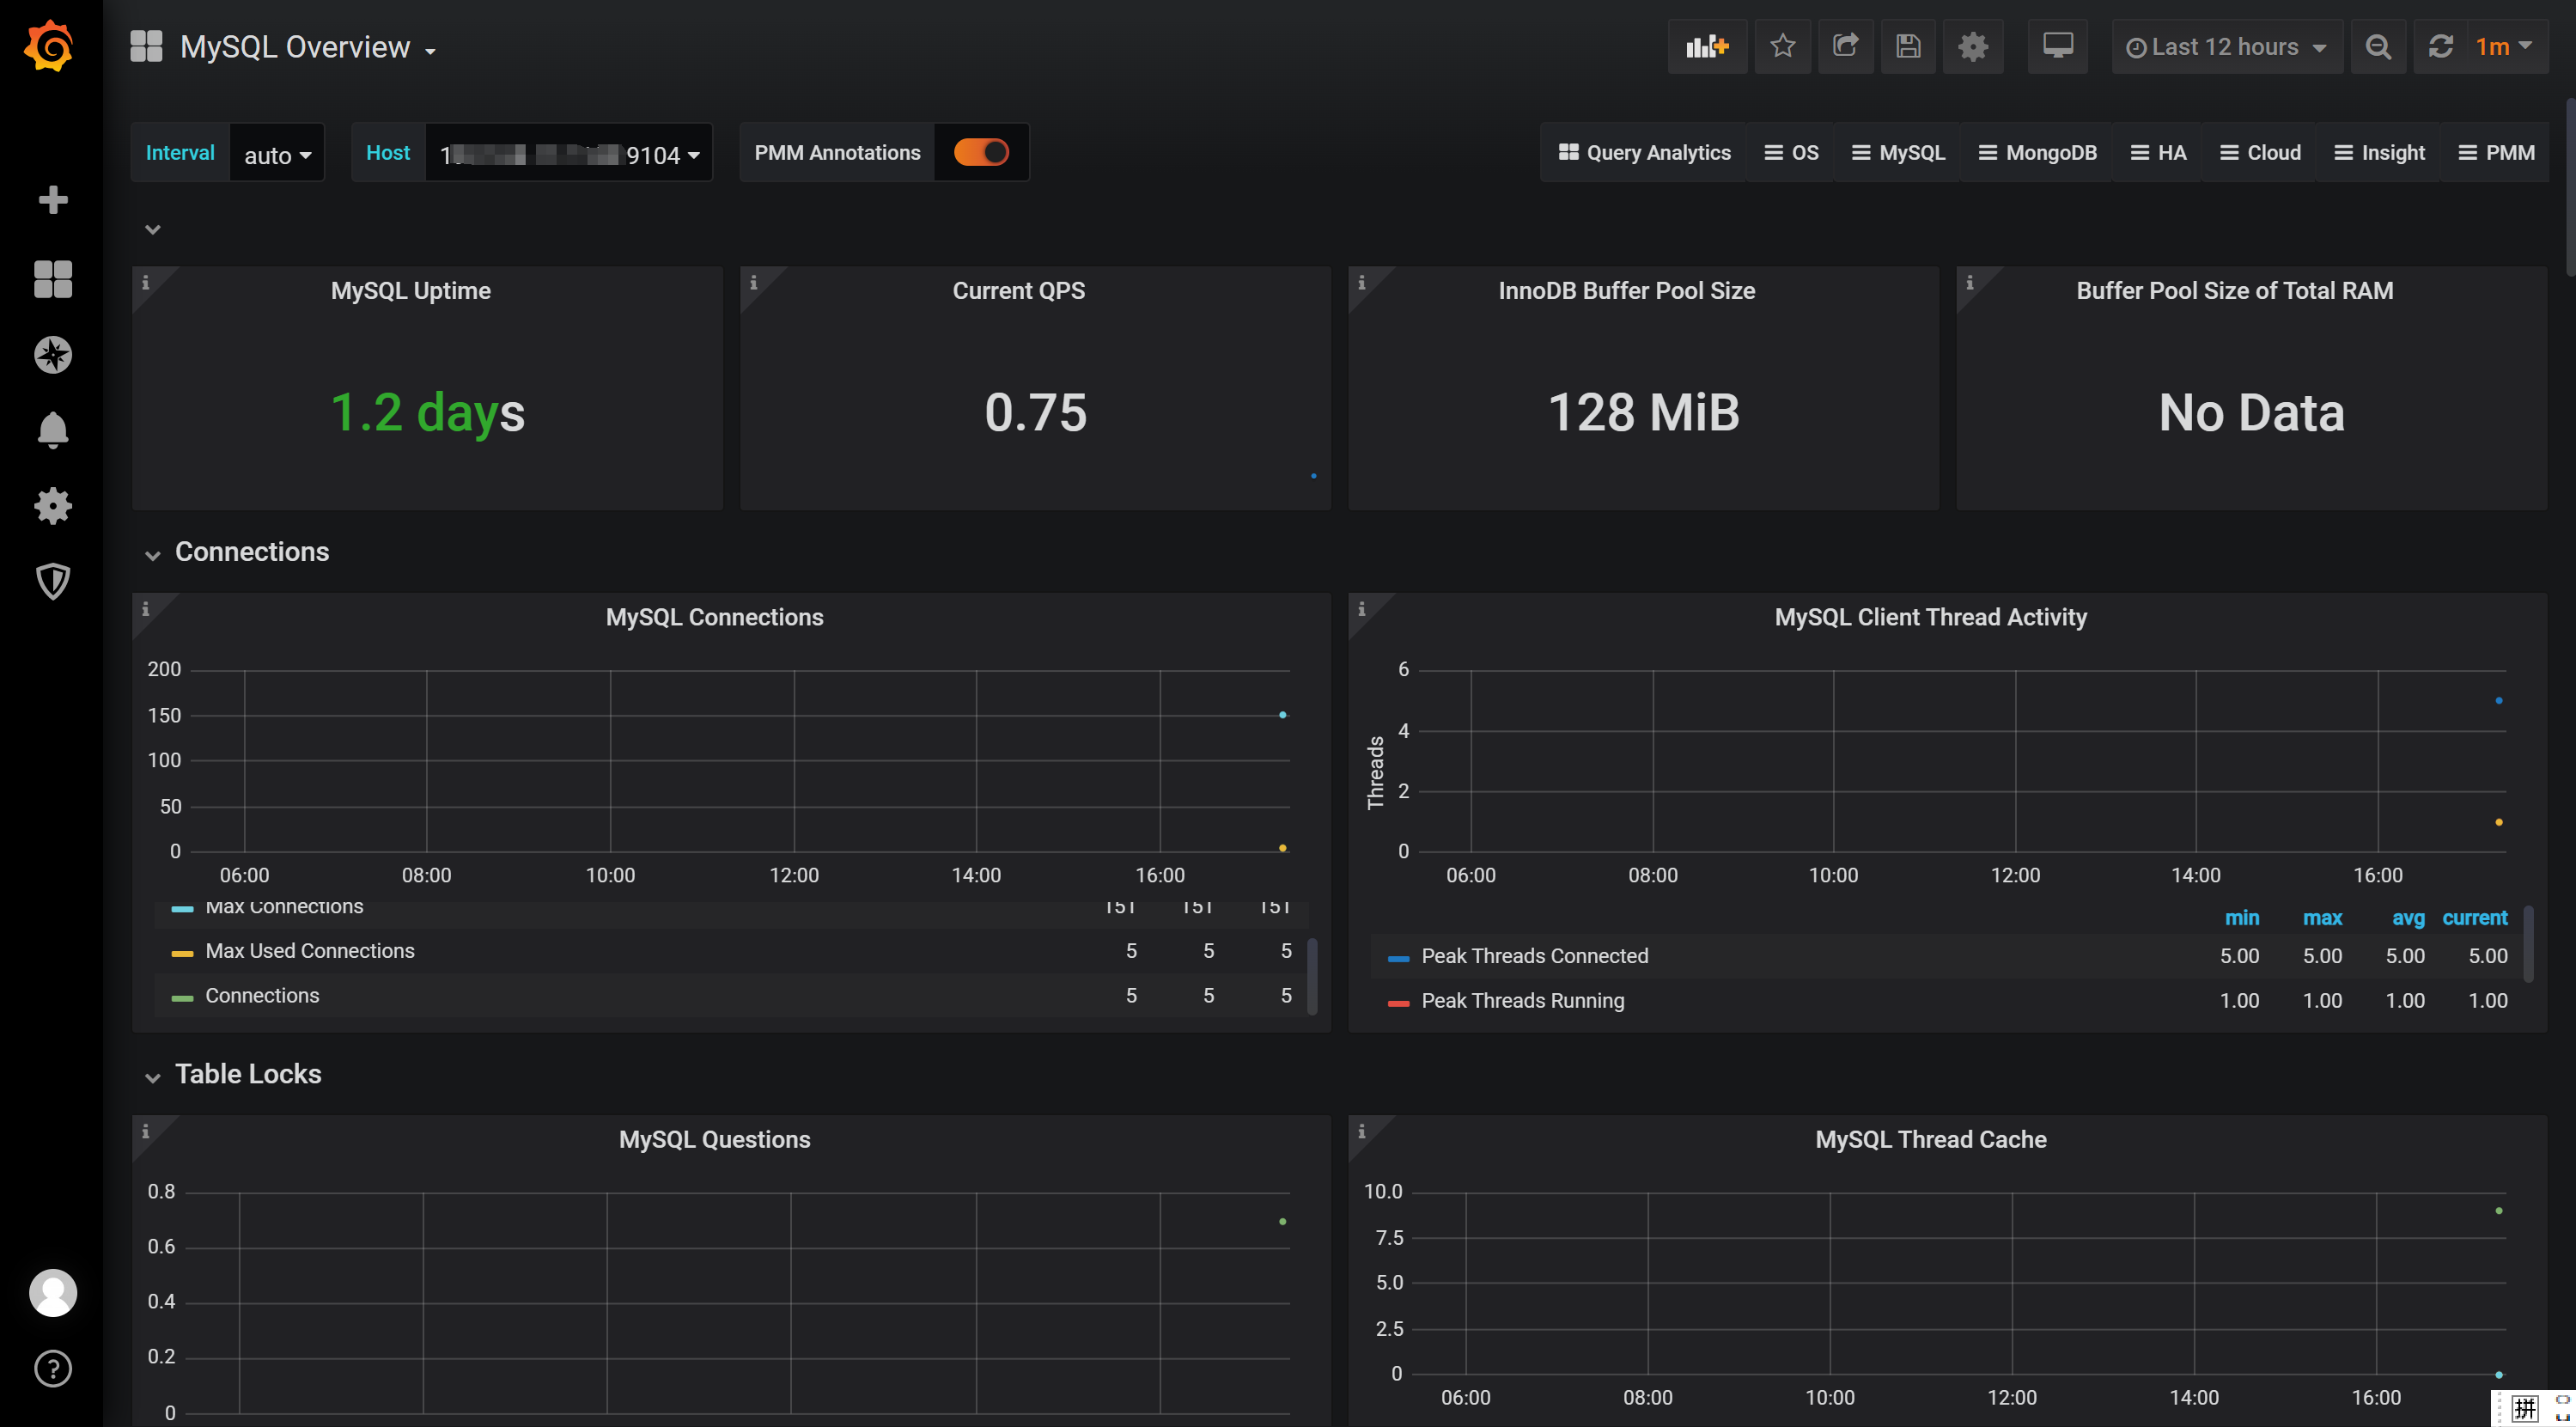
MySQL Overview 监控看板讲解
MySQL Overview 是Grafana中常用的MySQL监控看板,提供了全面的MySQL服务器性能指标可视化。下面我将详细解析这个看板的各个模块及其重要性。
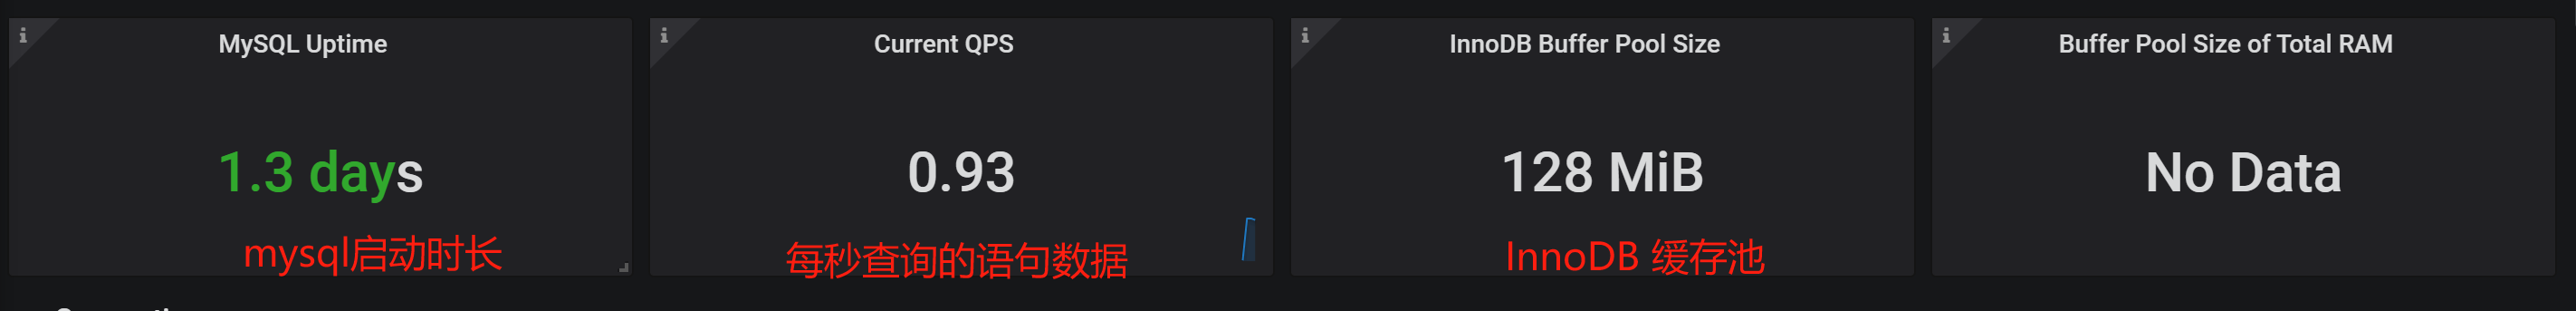
第一块区域
Current QPS: 每秒执行的语句数量
InnoDB Buffer Pool Size: InnoDB 缓冲池
配置值 SHOW GLOBAL VARIABLES like "%innodb_buffer_pool_size%"; 默认128M
状态值 show status like '%Innodb_buffer_pool%';
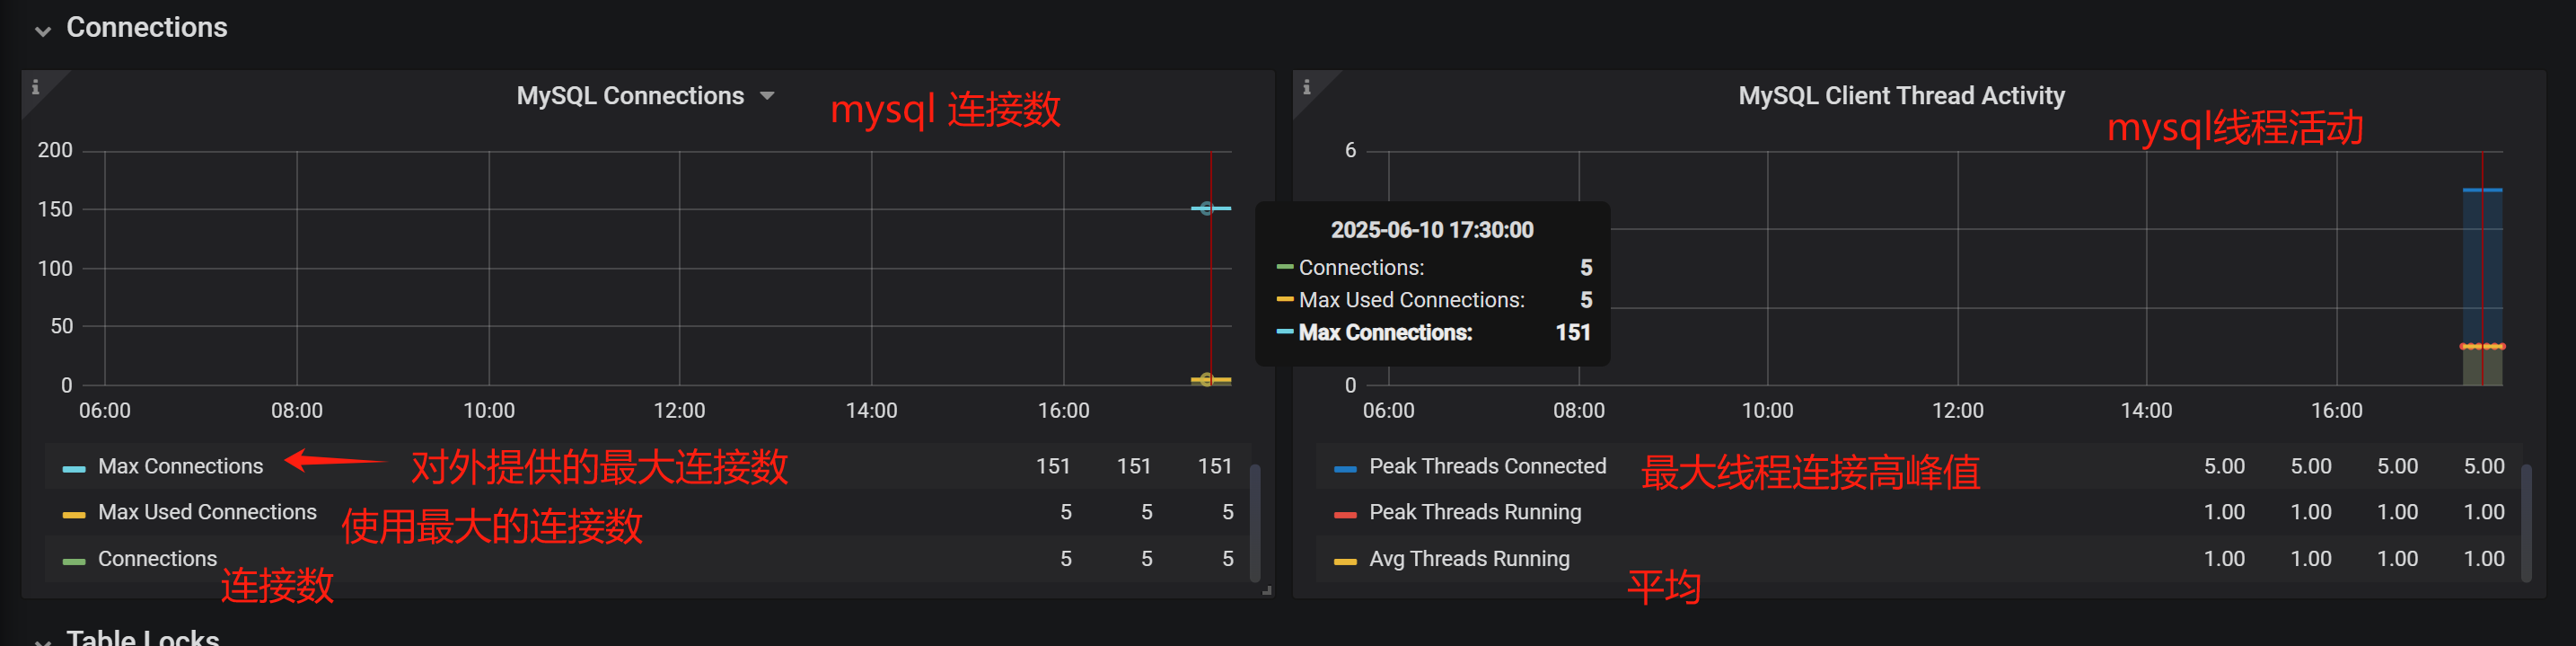
第二块区域:
Connections : MySQL 连接数
Max Used Connections : 最大已用连接数
Max Connections(对外提供的最大连接数), 可使用命令进行查看: show variables like '%max_connections%';
如果要修改最大连接数,则在配置文件my.cnf 修改 max_connections = 300
使用命令查看连接状态:
show status like '%connections%';
其他待补充,自行查看
| 监控类别 | 监控项 | 说明 | 相关命令/配置 | 优化建议 |
|---|---|---|---|---|
| Select Types | 全表扫描 | 检查是否有全表扫描操作 | EXPLAIN SELECT * FROM your_table WHERE ... |
添加合适的索引,优化查询语句 |
| Slow Queries | 慢查询数量 | 记录执行时间超过阈值的查询 | SHOW VARIABLES LIKE 'long_query_time';SHOW VARIABLES LIKE 'slow_query_log'; |
开启慢查询日志,优化慢查询 SQL |
| Table Locks | Waited(表锁等待次数) | 表锁等待次数,值越大说明锁竞争越严重 | SHOW STATUS LIKE 'Table_locks_waited'; |
优化事务设计,减少锁等待;检查索引是否合理 |
| Network Traffic | 网络流量 | MySQL 网络传输数据量 | SHOW STATUS LIKE 'Bytes_received';SHOW STATUS LIKE 'Bytes_sent'; |
监控网络带宽,优化查询减少数据传输量 |
| Top Command Counters | Select 等命令统计 | 统计各类 SQL 命令执行次数 | SHOW STATUS LIKE 'Com_select';SHOW STATUS LIKE 'Com_insert'; |
分析高频操作,针对性优化 |
| Query Cache Memory | query_cache_type | 查询缓存是否开启(默认 OFF) | SHOW VARIABLES LIKE 'query_cache_type'; |
若读多写少可开启:query_cache_type = 1 |
| query_cache_size | 查询缓存大小(默认 1M) | SHOW VARIABLES LIKE 'query_cache_size'; |
根据需求调整大小,如 SET GLOBAL query_cache_size = 64M; |
|
| query_cache_limit | 单条查询结果缓存上限 | SHOW VARIABLES LIKE 'query_cache_limit'; |
避免缓存过大结果集 | |
| Query Cache Activity | 缓存命中率(Qcache_hits) | 命中率=Qcache_hits/(Qcache_hits+Com_select),理想值 >90% | SHOW STATUS LIKE 'Qcache%'; |
命中率低可考虑关闭查询缓存 |
| Qcache_inserts | 未命中后插入缓存的次数 | |||
| Open Files | open_files_limit | MySQL 最大打开文件数(默认 65535) | SHOW VARIABLES LIKE 'open_files_limit'; |
确保足够应对高并发连接 |
| Open Tables | table_open_cache | 表缓存大小(默认 2000) | SHOW VARIABLES LIKE 'table_open_cache'; |
若 Opened_tables 值大,可适当增大此值 |
补充说明:
-
慢查询配置:
在my.cnf中配置:slow_query_log = 1 slow_query_log_file = /var/log/mysql/mysql-slow.log long_query_time = 2 # 超过2秒的查询记录 -
查询缓存开关:
在my.cnf中设置:query_cache_type = 1 query_cache_size = 64M -
锁等待优化:
-
检查事务隔离级别:
SHOW VARIABLES LIKE 'tx_isolation'; -
避免长事务,尽量使用行锁(InnoDB)。
-
-
监控工具建议:
-
使用
pt-query-digest分析慢查询日志。 -
通过 Prometheus + Grafana 可视化监控指标。
-

 浙公网安备 33010602011771号