
jvm-栈-监控 02
jstack 监控 jvm
1、查看java 运行项目的ip
[root@demo]# ps -ef |grep java
root 1521 1334 99 11:35 pts/0 07:53:06 java -Xms32M -Xmx32M -XX:+HeapDumpOnOutOfMemoryError -XX:HeapDumpPath=./ -jar gift-0.0.1-SNAPSHOT-obf.jar
root 2454 1550 0 16:27 pts/1 00:00:00 grep --color=auto java
You have new mail in /var/spool/mail/root
2、查看jstack pid ,
[root@demo]# jstack 1521
打印很多信息,复制其中一段栈信息,包含的信息
"http-nio-18089-BlockPoller" #17 daemon prio=5 os_prio=0 tid=0x00007fd4c0f36800 nid=0x604 runnable [0x00007fd490ca5000]
java.lang.Thread.State: RUNNABLE
at sun.nio.ch.EPollArrayWrapper.epollWait(Native Method)
at sun.nio.ch.EPollArrayWrapper.poll(EPollArrayWrapper.java:269)
at sun.nio.ch.EPollSelectorImpl.doSelect(EPollSelectorImpl.java:93)
at sun.nio.ch.SelectorImpl.lockAndDoSelect(SelectorImpl.java:86)
- locked <0x00000000fed51cc0> (a sun.nio.ch.Util$3)
- locked <0x00000000fed51cb0> (a java.util.Collections$UnmodifiableSet)
- locked <0x00000000fed51b88> (a sun.nio.ch.EPollSelectorImpl)
at sun.nio.ch.SelectorImpl.select(SelectorImpl.java:97)
at org.apache.tomcat.util.net.NioBlockingSelector$BlockPoller.run(NioBlockingSelector.java:331)
3、查看栈包含的信息以及含义
http-nio-18089-BlockPoller -线程名称
#17 -编号
daemon --线程类型,是守护线程
prio=5 --线程优先级
os_prio=0 --系统优先级
tid=0x00007fd4c0f3680 -JVM内部线程的唯一标识
nid=0x604 - netv id 线程对应的本地线程id号,本地线程才是真实的线程实体
runnable -本地线程状态
[0x00007fd490ca5000]--线程占用的内存地址
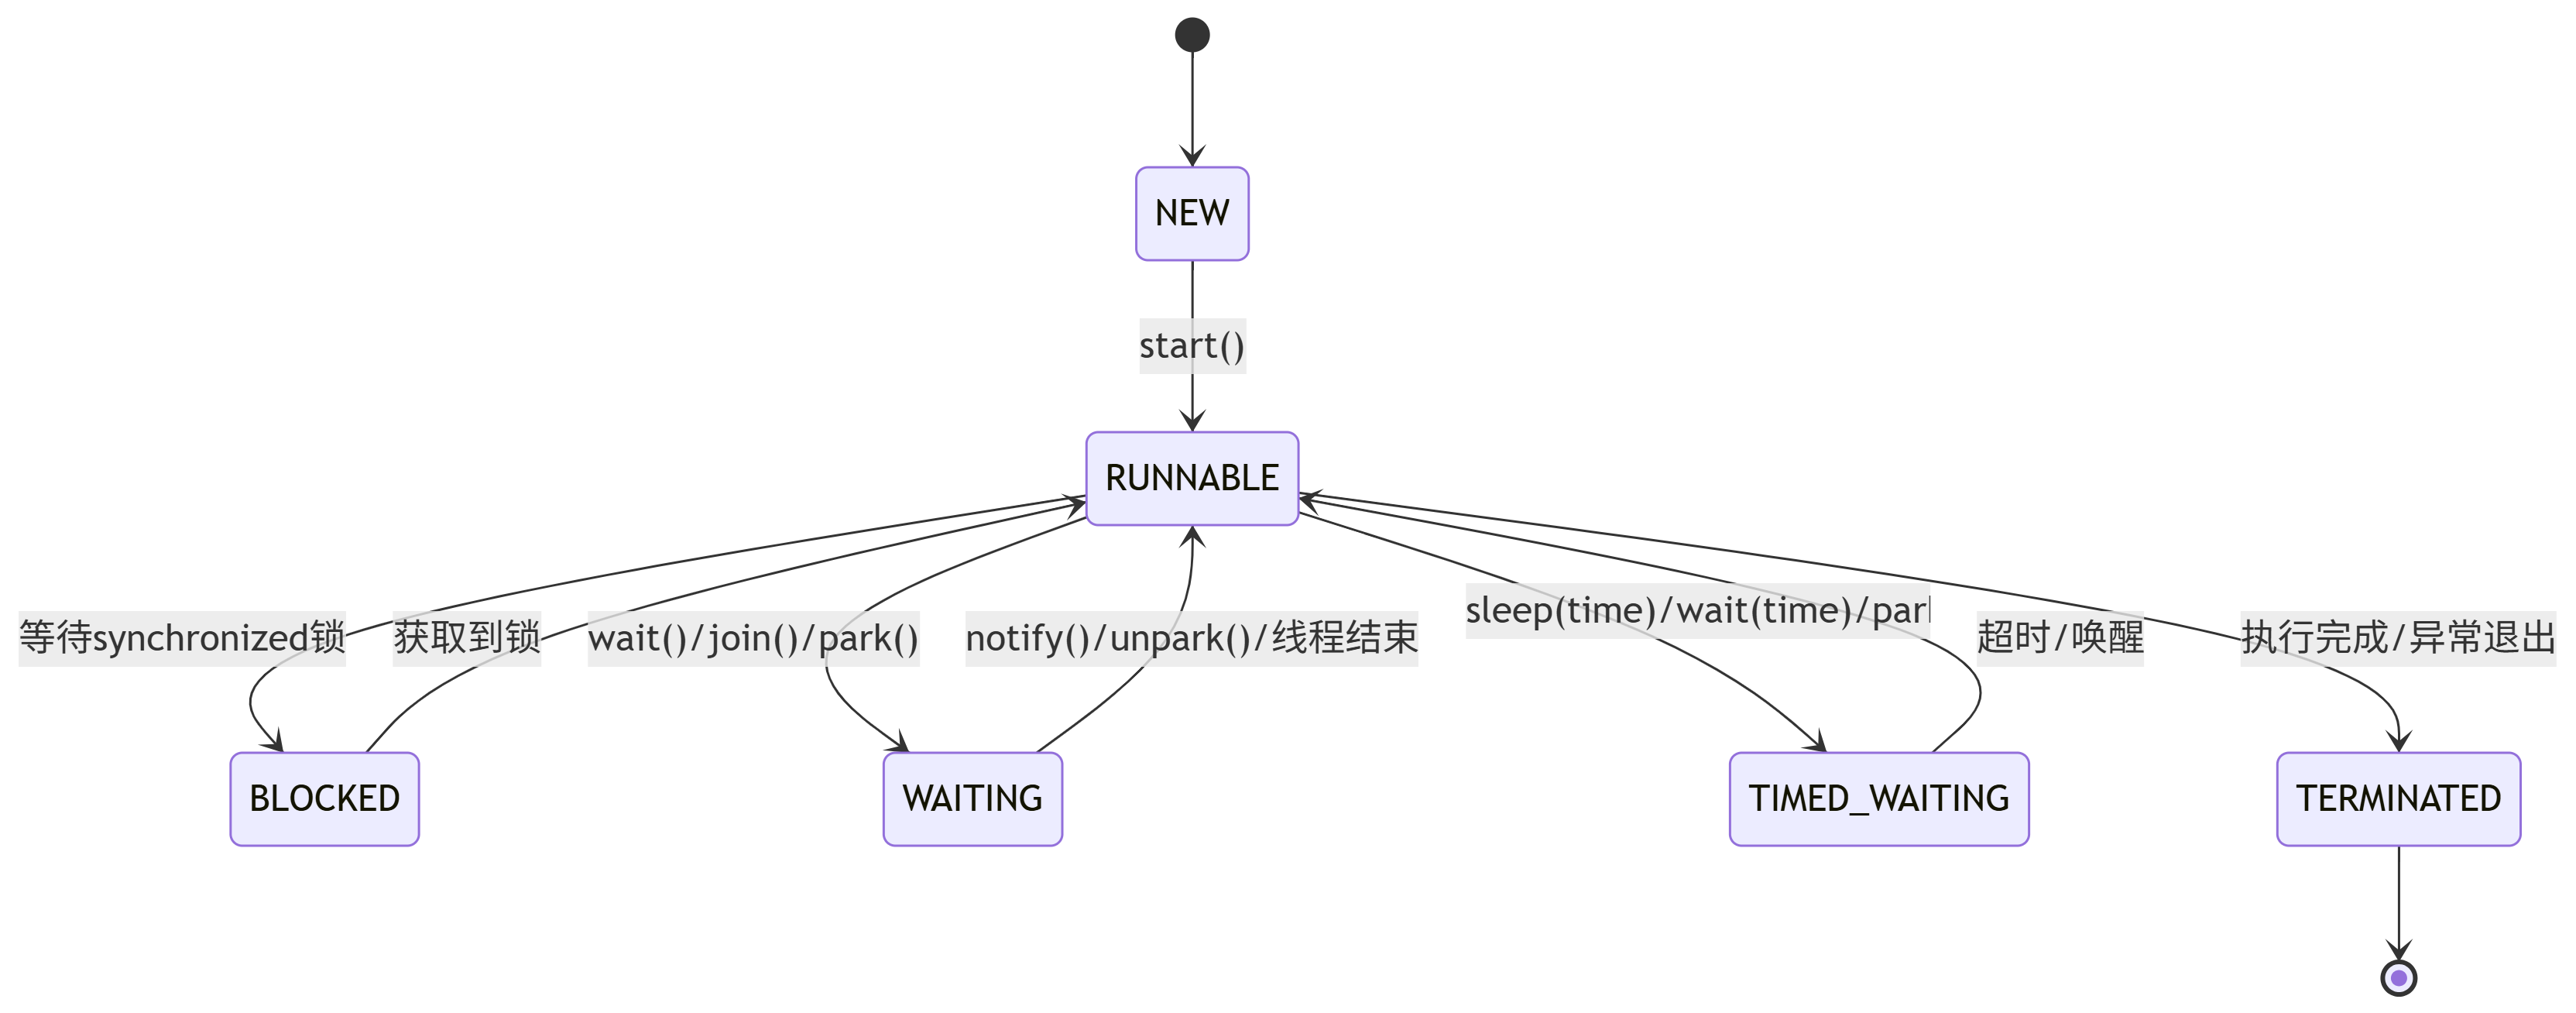
4、JVM 线程运行的状态,JVM thread status 有如下五个:
在 Java 中,线程的状态可以通过 Thread.State 枚举类来表示,也可以通过 jstack 等工具查看线程转储(thread dump)中的状态。以下是 JVM 线程的主要状态及其含义:
New Runnable Blocked WaiTing Time_Waiting Terminated
1. NEW (新建)
-
线程刚被创建,但尚未调用
start()方法 -
此时线程还未开始执行
2. RUNNABLE (可运行)
-
线程正在 JVM 中执行,或准备就绪等待操作系统分配 CPU 资源
-
包括两种子状态:
-
Ready:等待 CPU 时间片
-
Running:正在 CPU 上执行
-
对应的线程样子:java.lang.Thread.State: RUNNABLE
3. BLOCKED (阻塞)
-
线程被阻塞,等待获取监视器锁(monitor lock)
-
通常发生在进入
synchronized方法/代码块时,锁已被其他线程持有 -
在
jstack输出中显示为 "BLOCKED (on object monitor)"
java.lang.Thread.State: BLOCKED (on object monitor)
4. WAITING (无限期等待)
-
线程主动进入等待状态,直到被其他线程显式唤醒
-
常见场景:
-
Object.wait()(未设置超时) -
Thread.join()(未设置超时) -
LockSupport.park()
-
-
在
jstack中通常显示为 "WAITING (on object monitor)" 或 "WAITING (parking)"
java.lang.Thread.State: WAITING (parking):一直等某个条件发生
java.lang.Thread.State: TIMED_WAITING (parking或sleeping):定时的,某个条件不到来,也将定时唤醒自己
5. TIMED_WAITING (限期等待)
-
线程进入有时间限制的等待状态
-
常见场景:
-
Thread.sleep(long) -
Object.wait(long) -
Thread.join(long) -
LockSupport.parkNanos() -
LockSupport.parkUntil()
-
-
在
jstack中显示为 "TIMED_WAITING (sleeping)" 或 "TIMED_WAITING (on object monitor)"
6. TERMINATED (终止)
-
线程已完成执行,或者因异常而终止
线程状态转换图
死锁(Deadlock)示例
重点关注中间四种状态 blocke,runable,waiting,time_waiting
blocked状态与waiting状态的区别
1. 基本定义区别
| 状态 | BLOCKED (阻塞) | WAITING (等待) |
|---|---|---|
| 触发方式 | 被动阻塞,由JVM自动设置 | 主动等待,由程序显式调用方法触发 |
| 恢复方式 | 当获取到监视器锁时自动恢复 | 必须由其他线程显式唤醒(notify/interrupt) |
栈中,锁的信息
线程堆栈(jstack 或 Thread Dump)中的锁信息
示例 1:BLOCKED 状态的线程
"Thread-1" #12 prio=5 os_prio=0 tid=0x00007f487c0b8000 nid=0x4e1 waiting for monitor entry [0x00007f487a7e7000]
   java.lang.Thread.State: BLOCKED (on object monitor)
        at com.example.LockDemo.syncMethod(LockDemo.java:10)
        - waiting to lock <0x000000076bf0b0d0> (a com.example.LockDemo)  // 锁对象的地址
关键信息:
-
waiting for monitor entry:线程因竞争锁失败进入BLOCKED状态。 -
waiting to lock <0x000000076bf0b0d0>:被阻塞的锁对象的内存地址(可用于关联其他线程的持有者)
示例 2:持有锁的线程
"Thread-0" #11 prio=5 os_prio=0 tid=0x00007f487c0b6000 nid=0x4e0 runnable [0x00007f487a8e8000]
   java.lang.Thread.State: RUNNABLE
        at com.example.LockDemo.syncMethod(LockDemo.java:8)
        - locked <0x000000076bf0b0d0> (a com.example.LockDemo)  // 当前线程持有的锁
-
关键信息:
-
locked <0x000000076bf0b0d0>:线程当前持有的锁对象地址(与Thread-1等待的是同一个锁)。
-
----------------------------
arthas
1、先启动一个java 项目,查看pid
[root@demo]# nohup java -jar test.jar &
[1] 3051
[root@demo]# nohup: ignoring input and appending output to ‘nohup.out’
[root@demo]# ps -ef |grep java
root 3051 1334 49 19:56 pts/0 00:00:10 java -jar test.jar
root 3075 1334 0 19:57 pts/0 00:00:00 grep --color=auto java
pid是3051
2、下载arthas-boot.jar 使用arthas 查看, 可以看到运行的test.jar 项目,如果启动多个项目则下面展示多个。
[root@demo]# java -jar arthas-boot.jar
[INFO] arthas-boot version: 3.4.5
[INFO] Found existing java process, please choose one and input the serial number of the process, eg : 1. Then hit ENTER.
* [1]: 3051 test.jar
1 ---输入1
[INFO] Start download arthas from remote server: https://arthas.aliyun.com/download/4.0.5?mirror=aliyun
[INFO] Download arthas success.
[INFO] arthas home: /root/.arthas/lib/4.0.5/arthas
[INFO] Try to attach process 3051
[INFO] Attach process 3051 success.
[INFO] arthas-client connect 127.0.0.1 3658
,---. ,------. ,--------.,--. ,--. ,---. ,---.
/ O \ | .--. ''--. .--'| '--' | / O \ ' .-'
| .-. || '--'.' | | | .--. || .-. |`. `-.
| | | || |\ \ | | | | | || | | |.-' |
`--' `--'`--' '--' `--' `--' `--'`--' `--'`-----'
wiki https://arthas.aliyun.com/doc
tutorials https://arthas.aliyun.com/doc/arthas-tutorials.html
version 4.0.5
main_class test.jar
pid 3051
start_time 2025-05-29 19:56:44.319
currnt_time 2025-05-29 20:03:12.476
[arthas@3051]$ ---已进入arthas
看到以上信息,就代表arthas 监控这个进程ok
---arthas常用命令:trace、thread、dashboard
3、接下来就进入到了arthas 进程,就可以输入help 去查看
[arthas@3051]$ help 显示很多信息
[arthas@3051]$ help
NAME DESCRIPTION
help Display Arthas Help
auth Authenticates the current session
keymap Display all the available keymap for the specified connection.
sc Search all the classes loaded by JVM
sm Search the method of classes loaded by JVM
classloader Show classloader info
jad Decompile class
getstatic Show the static field of a class
monitor Monitor method execution statistics, e.g. total/success/failure count, average rt, fai
l rate, etc.
stack Display the stack trace for the specified class and method
thread Display thread info, thread stack
trace Trace the execution time of specified method invocation.
watch Display the input/output parameter, return object, and thrown exception of specified m
ethod invocation
tt Time Tunnel
jvm Display the target JVM information
memory Display jvm memory info.
perfcounter Display the perf counter information.
ognl Execute ognl expression.
mc Memory compiler, compiles java files into bytecode and class files in memory.
redefine Redefine classes. @see Instrumentation#redefineClasses(ClassDefinition...)
retransform Retransform classes. @see Instrumentation#retransformClasses(Class...)
dashboard Overview of target jvm's thread, memory, gc, vm, tomcat info.
dump Dump class byte array from JVM
heapdump Heap dump
options View and change various Arthas options
cls Clear the screen
reset Reset all the enhanced classes
version Display Arthas version
session Display current session information
sysprop Display and change the system properties.
sysenv Display the system env.
vmoption Display, and update the vm diagnostic options.
logger Print logger info, and update the logger level
history Display command history
cat Concatenate and print files
base64 Encode and decode using Base64 representation
echo write arguments to the standard output
pwd Return working directory name
mbean Display the mbean information
grep grep command for pipes.
tee tee command for pipes.
profiler Async Profiler. https://github.com/jvm-profiling-tools/async-profiler
vmtool jvm tool
stop Stop/Shutdown Arthas server and exit the console.
4、如果要某个命令操作 ,比如 trace
[arthas@3051]$ trace -h ---就会出来这个命令的用法
5、退出arthas 有两个命令,一个是stop,一个是quit
quit 不会关闭arthas服务
stop 会关闭服务
演示:
[arthas@3051]$ quit ------退出服务
Session has been terminated.
Arthas is still running in the background.
To completely shutdown arthas, please execute the 'stop' command.
You have new mail in /var/spool/mail/root
[root@demo]# netstat -lntp |grep 3658 --- 从上面([INFO] Attach process 3051success.[INFO] arthas-client connect 127.0.0.1 3658)可以看到这个服务有这个端口,可以检查看以是否还存在
tcp6 0 0 127.0.0.1:3658 :::* LISTEN 3051/java --可以看到服务还存在
[root@demo]#
6、重新进入arthas 服务,查看dashboard,
[root@demo]# java -jar arthas-boot.jar
[arthas@3051]$ dashboard ------显示当前系统的实时数据面板
7、使用 thread
Arthas thread 命令参数对照表
| 命令格式 | 功能说明 | 示例/备注 |
|---|---|---|
thread |
查看所有线程信息(ID、状态、CPU占用等) | 默认按CPU使用率排序 |
thread -n 3 |
显示最繁忙的3个线程(CPU占用最高) | -n 参数指定显示数量 |
thread <id> |
查看指定线程的详细堆栈信息 | id 为 thread 命令输出的第一列 |
thread -b |
快速定位阻塞(BLOCKED)线程 | 等价于 thread --state BLOCKED |
thread --state BLOCKED |
查看所有处于阻塞状态的线程 | 支持其他状态:RUNNABLE、WAITING等 |
thread | grep "xxx" |
过滤线程信息(按关键字) | 如:thread | grep "http-nio" |
thread | grep BLOCKED |
过滤所有阻塞线程(与 -b 效果相同) |
等价于 thread --state BLOCKED |
使用场景示例
| 场景 | 命令 | 目的 |
|---|---|---|
| 定位CPU飙升问题 | thread -n 3 |
找出最消耗CPU的线程 |
| 分析死锁 | thread -b |
快速查看阻塞线程的锁竞争 |
| 监控线程池状态 | thread | grep "pool-" |
过滤线程池相关线程 |
| 检查I/O等待 | thread --state TIMED_WAITING |
查看因超时等待(如网络IO)的线程 |
示例1:查看 thread --state BLOCKED
[arthas@1456]$ thread --state BLOCKED
Threads Total: 22, NEW: 0, RUNNABLE: 11, BLOCKED: 2, WAITING: 5, TIMED_WAITING: 4, TERMINATED: 0
ID NAME GROUP PRIORITY STATE %CPU DELTA_TI TIME INTERRUP DAEMON
16 线程2 main 5 BLOCKED 0.02 0.000 0:0.014 false false
15 线程1 main 5 BLOCKED 0.01 0.000 0:0.014 false false
8、使用trace
trace 是 Arthas 中非常强大的性能分析命令,用于追踪方法内部调用路径,并统计每个节点的耗时情况
查看帮助 :trace -h
基本语法: trace [全限定类名] [方法名] [参数选项]
常用场景和示例
场景1:追踪方法调用链耗时
[arthas@3051]$ trace com.gift.controller.OrderController findByOrderNumber
-
作用:追踪
findByOrderNumber方法的完整调用链,显示每个调用节点的耗时 -
输出:会显示方法调用的树形结构,包含每个节点的耗时(ms)
场景2:限制追踪次数
[arthas@3051]$ trace com.gift.controller.OrderController findByOrderNumber -n 2
-
-n 2:只捕捉2次请求的追踪信息 -
适用场景:在高流量环境下,避免产生过多日志
场景3:按耗时筛选
[arthas@3051]$ trace com.gift.controller.OrderController findByOrderNumber '#cost>1000'
-
#cost>1000:只显示耗时超过1000ms的调用 -
适用场景:快速定位性能瓶颈
场景4:深入追踪耗时方法
如果发现某个被调用的方法耗时较长,可以继续追踪该方法
trace com.gift.service.impl.OrderServiceImpl queryOrderDetail
-
方法论:从外层到内层逐步深入追踪,定位最终的性能瓶颈
高级用法
1. 追踪重载方法
trace com.example.Class *methodName params.length==2
-
可以指定参数个数或类型来区分重载方法
2. 排除特定调用
trace com.example.Class methodName -E "java.lang.Thread|java.util.concurrent"
-
-E参数用于排除不想看到的调用路径
3. 观察调用上下文
trace com.example.Class methodName -v
-
-v参数可以打印更详细的调用信息
适用场景
-
定位接口性能瓶颈:快速发现接口中哪个方法调用耗时最长
-
分析复杂调用链:理清多层嵌套调用的性能分布
-
优化前后对比:在优化前后分别trace,验证优化效果
-
生产环境诊断:无需修改代码或重启服务,实时分析性能问题

 浙公网安备 33010602011771号