
JVM-堆-分析、调优-02
一、 压测过程中,堆问题分析定位有:
1、运行日志; 2、分析dump日志;3、 GC日志
二、常见的问题: OOM(OutOfMemoryError) ,gc耗时/吞吐量低
在性能压测(Performance Testing)中,OOM(Out Of Memory) 是 内存耗尽错误 的统称,指应用程序因无法申请到足够内存而崩溃。如: java heap space
1. OOM 的本质
触发条件:
JVM 或系统内存(堆、栈、直接内存等)被耗尽,无法满足新对象分配或操作需求。
典型表现:
压测过程中出现 java.lang.OutOfMemoryError 异常,伴随服务崩溃、响应中断。
三、演示
1、OOM
1.1 编写jmter脚本,会触发java heap space
1.2 启动java项目
[root@demo]# java -Xms32M -Xmx32M -XX:+HeapDumpOnOutOfMemoryError -XX:HeapDumpPath=./ -jar test.jar
1.3 执行Jmeter脚本,是用得1.2的java项目
1.4 dump 堆文件
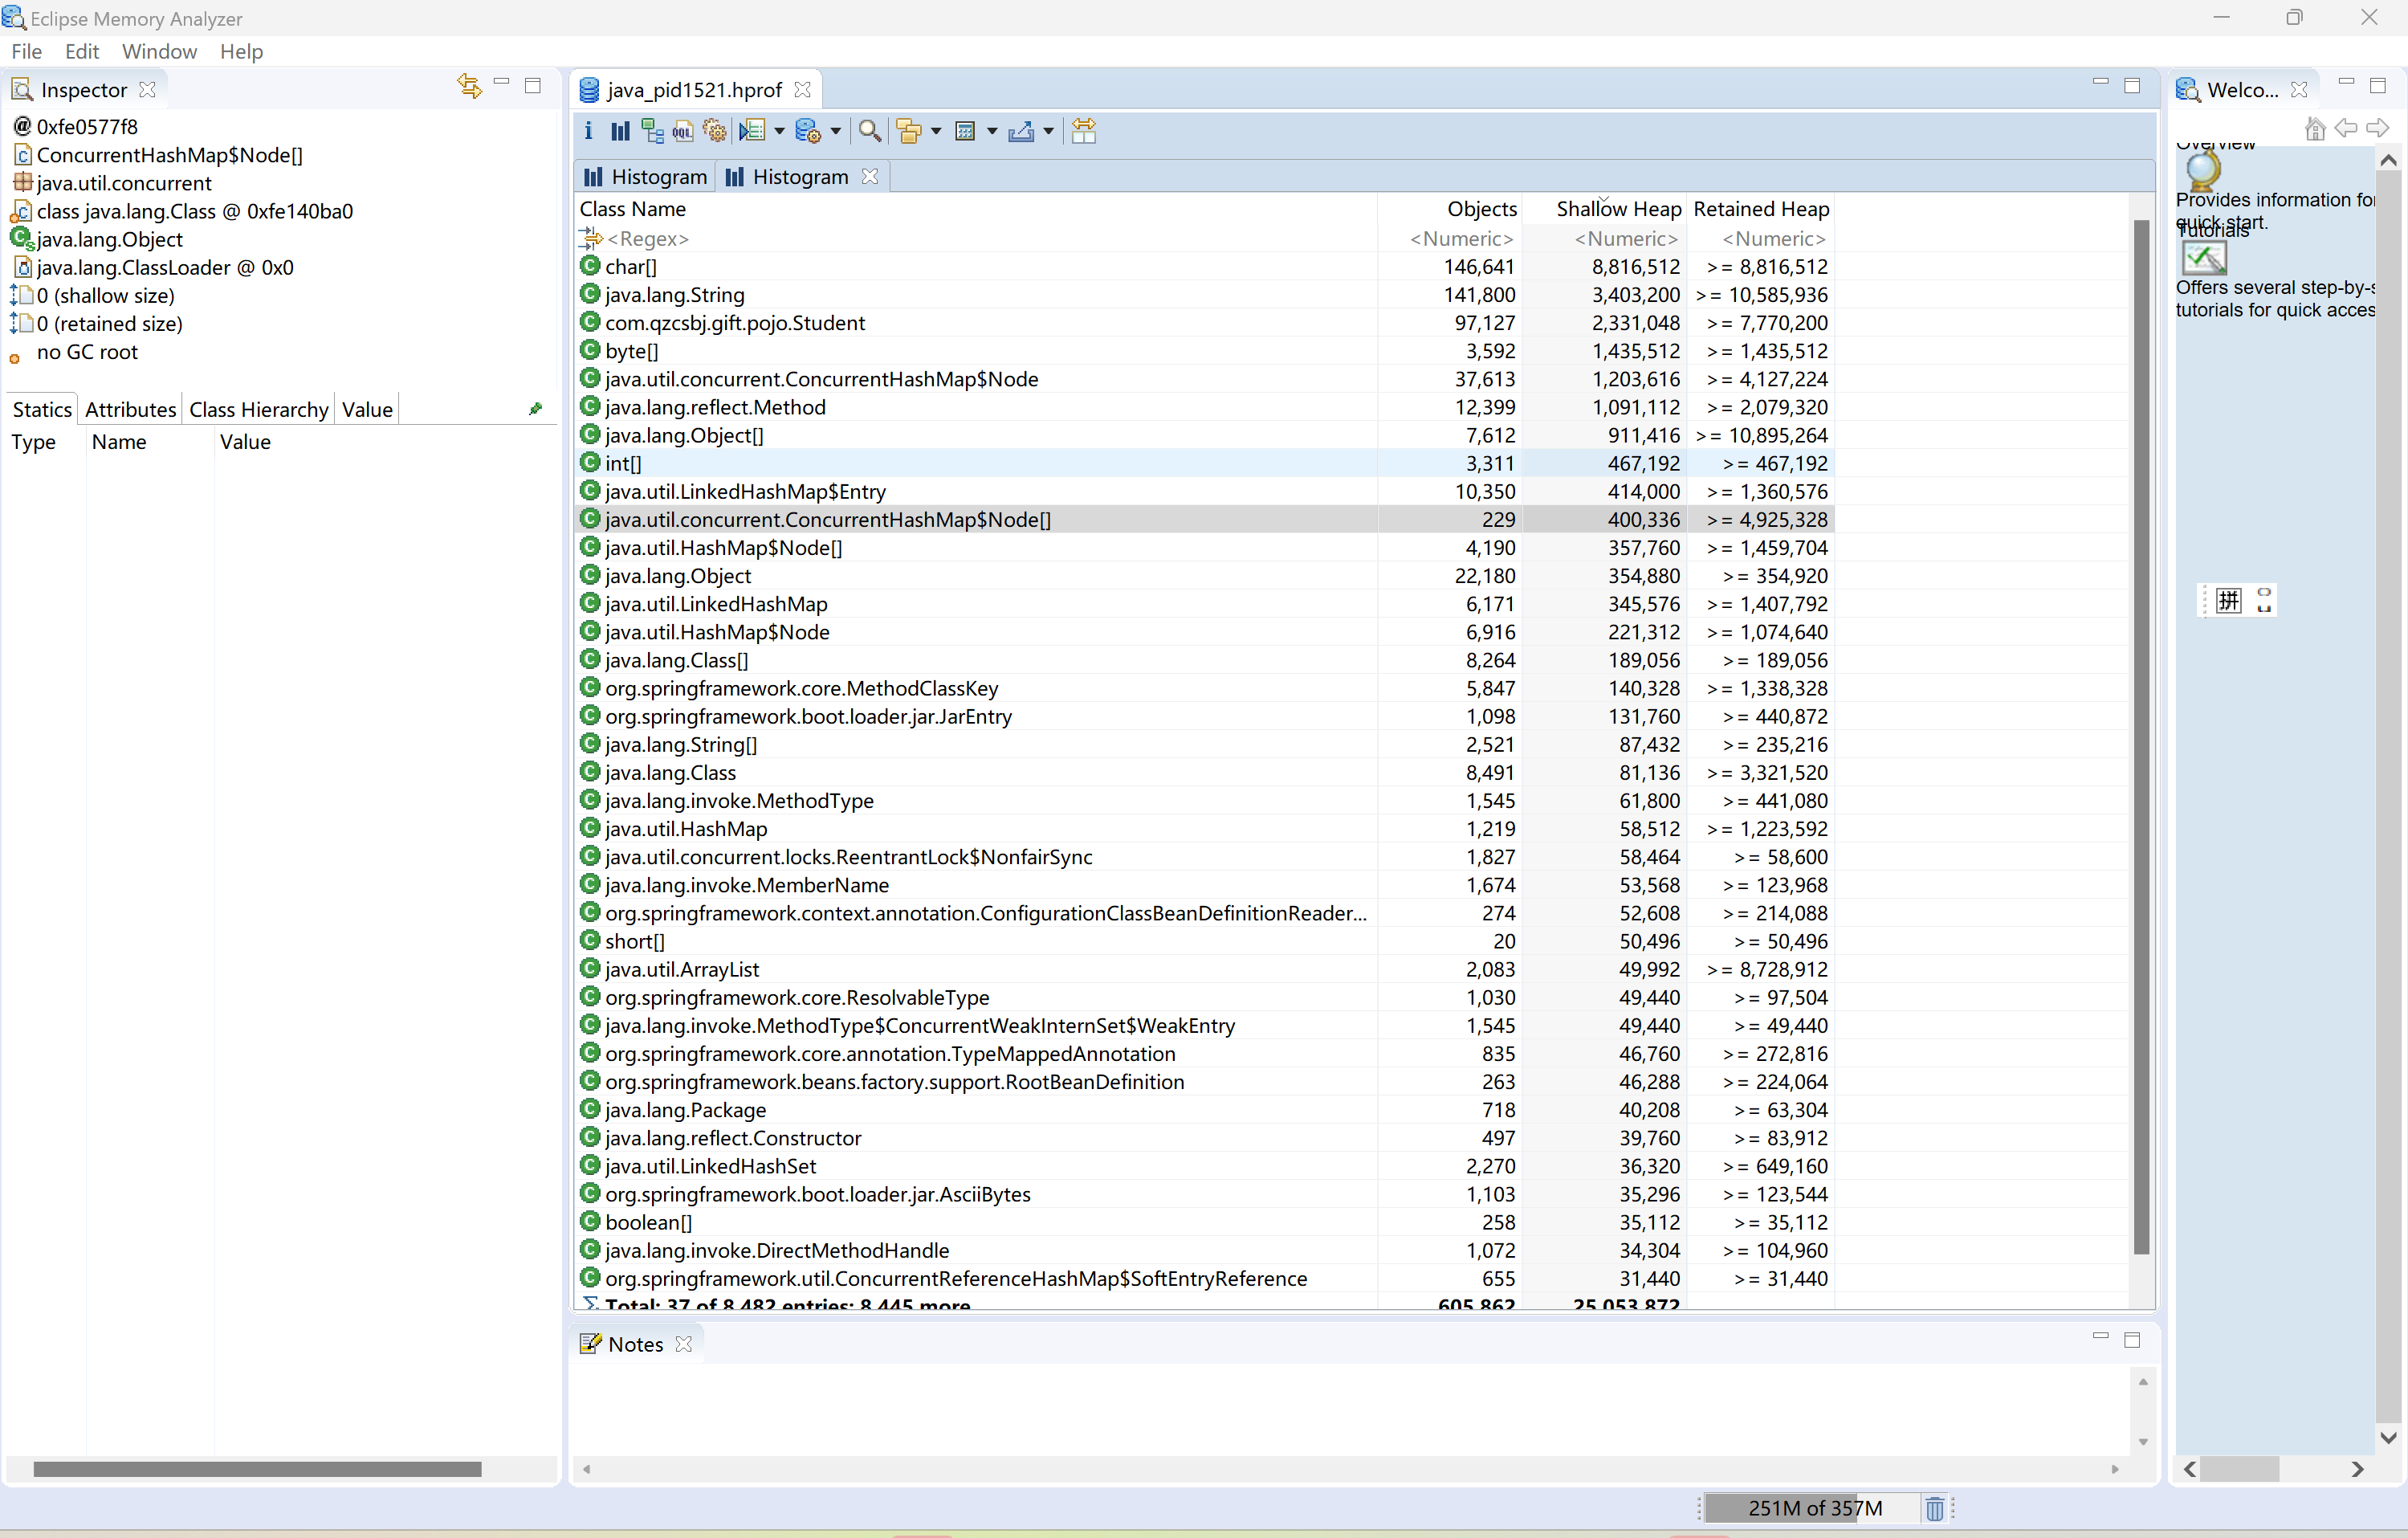
1.5 使用Mat工具打开,MemoryAnalyzer.exe 工具
1.6 打开 dump的文件,进行查看分析
---------------------
2、gc耗时/吞吐量低 gc日志、分析调优
2.1 生成gc日志
启动java程序,生成gc日志 (主要使用的是ParallelGC )
[root@demo]# java -XX:+PrintGCDetails -XX:+PrintGCTimeStamps -XX:+PrintGCDateStamps -Xloggc:gc.log -jar test.jar
如果要使用其他的GC,比如CMS 或者G1 则如下
[root@demo]# java -XX:+UseConcMarkSweepGC -XX:+UseParNewGC -XX:+PrintFlagsFinal -XX:+PrintGCDetails -XX:+PrintGCTimeStamps -XX:+PrintGCDateStamps -Xloggc:gc.log -Xms30M -Xmx30M -XX:+HeapDumpOnOutOfMemoryError -XX:HeapDumpPath=./ -jar test.jar
[root@demo]# java -XX:+UseG1GC -XX:+PrintFlagsFinal -XX:+PrintGCDetails -XX:+PrintGCTimeStamps -XX:+PrintGCDateStamps -Xloggc:gc.log -Xms5120M -Xmx5120M -XX:+HeapDumpOnOutOfMemoryError -XX:HeapDumpPath=./ -jar test.jar
2.2 查看生成的gc日志
[root@demo]# tail -fn10 gc.log
2025-05-28T17:15:02.495+0800: 0.959: [GC (Allocation Failure) [PSYoungGen: 35840K->1013K(35840K)] 38714K->5763K(57856K), 0.0049336 secs] [Times: user=0.01 sys=0.00, real=0.01 secs]
2025-05-28T17:15:02.758+0800: 1.223: [GC (Allocation Failure) [PSYoungGen: 35829K->3045K(72192K)] 40579K->8259K(94208K), 0.0116971 secs] [Times: user=0.03 sys=0.00, real=0.02 secs]
2025-05-28T17:15:03.049+0800: 1.513: [GC (Metadata GC Threshold) [PSYoungGen: 61449K->3541K(72704K)] 66663K->9281K(94720K), 0.0082554 secs] [Times: user=0.02 sys=0.00, real=0.01 secs]
2025-05-28T17:15:03.057+0800: 1.522: [Full GC (Metadata GC Threshold) [PSYoungGen: 3541K->0K(72704K)] [ParOldGen: 5739K->8363K(24576K)] 9281K->8363K(97280K), [Metaspace: 20339K->20339K(1067008K)], 0.0699958 secs] [Times: user=0.13 sys=0.01, real=0.07 secs]
2025-05-28T17:15:03.452+0800: 1.916: [GC (Allocation Failure) [PSYoungGen: 69120K->4096K(98816K)] 77483K->14035K(123392K), 0.0104599 secs] [Times: user=0.02 sys=0.00, real=0.01 secs]
2025-05-28T17:15:03.842+0800: 2.306: [GC (Allocation Failure) [PSYoungGen: 98816K->5632K(125440K)] 108755K->19787K(150016K), 0.0250580 secs] [Times: user=0.03 sys=0.01, real=0.02 secs]
2025-05-28T17:15:05.066+0800: 3.530: [GC (Allocation Failure) [PSYoungGen: 125440K->2036K(132608K)] 139595K->24164K(157184K), 0.0319277 secs] [Times: user=0.05 sys=0.01, real=0.03 secs]
2025-05-28T17:15:05.098+0800: 3.563: [Full GC (Ergonomics) [PSYoungGen: 2036K->0K(132608K)] [ParOldGen: 22128K->14211K(43008K)] 24164K->14211K(175616K), [Metaspace: 26992K->26992K(1075200K)], 0.0881806 secs] [Times: user=0.16 sys=0.00, real=0.09 secs]
2025-05-28T17:15:06.426+0800: 4.891: [GC (Allocation Failure) [PSYoungGen: 130560K->7770K(140800K)] 144771K->21989K(183808K), 0.0173861 secs] [Times: user=0.02 sys=0.00, real=0.02 secs]
2025-05-28T17:15:07.745+0800: 6.210: [GC (Allocation Failure) [PSYoungGen: 138330K->10746K(153600K)] 152549K->25886K(196608K), 0.0289145 secs] [Times: user=0.05 sys=0.01, real=0.03 secs]
2.3 下载gc文件,使用gcviewer-1.36-SNAPSHOT.jar 工具查看
查看Event details ,summary ,Pause ,
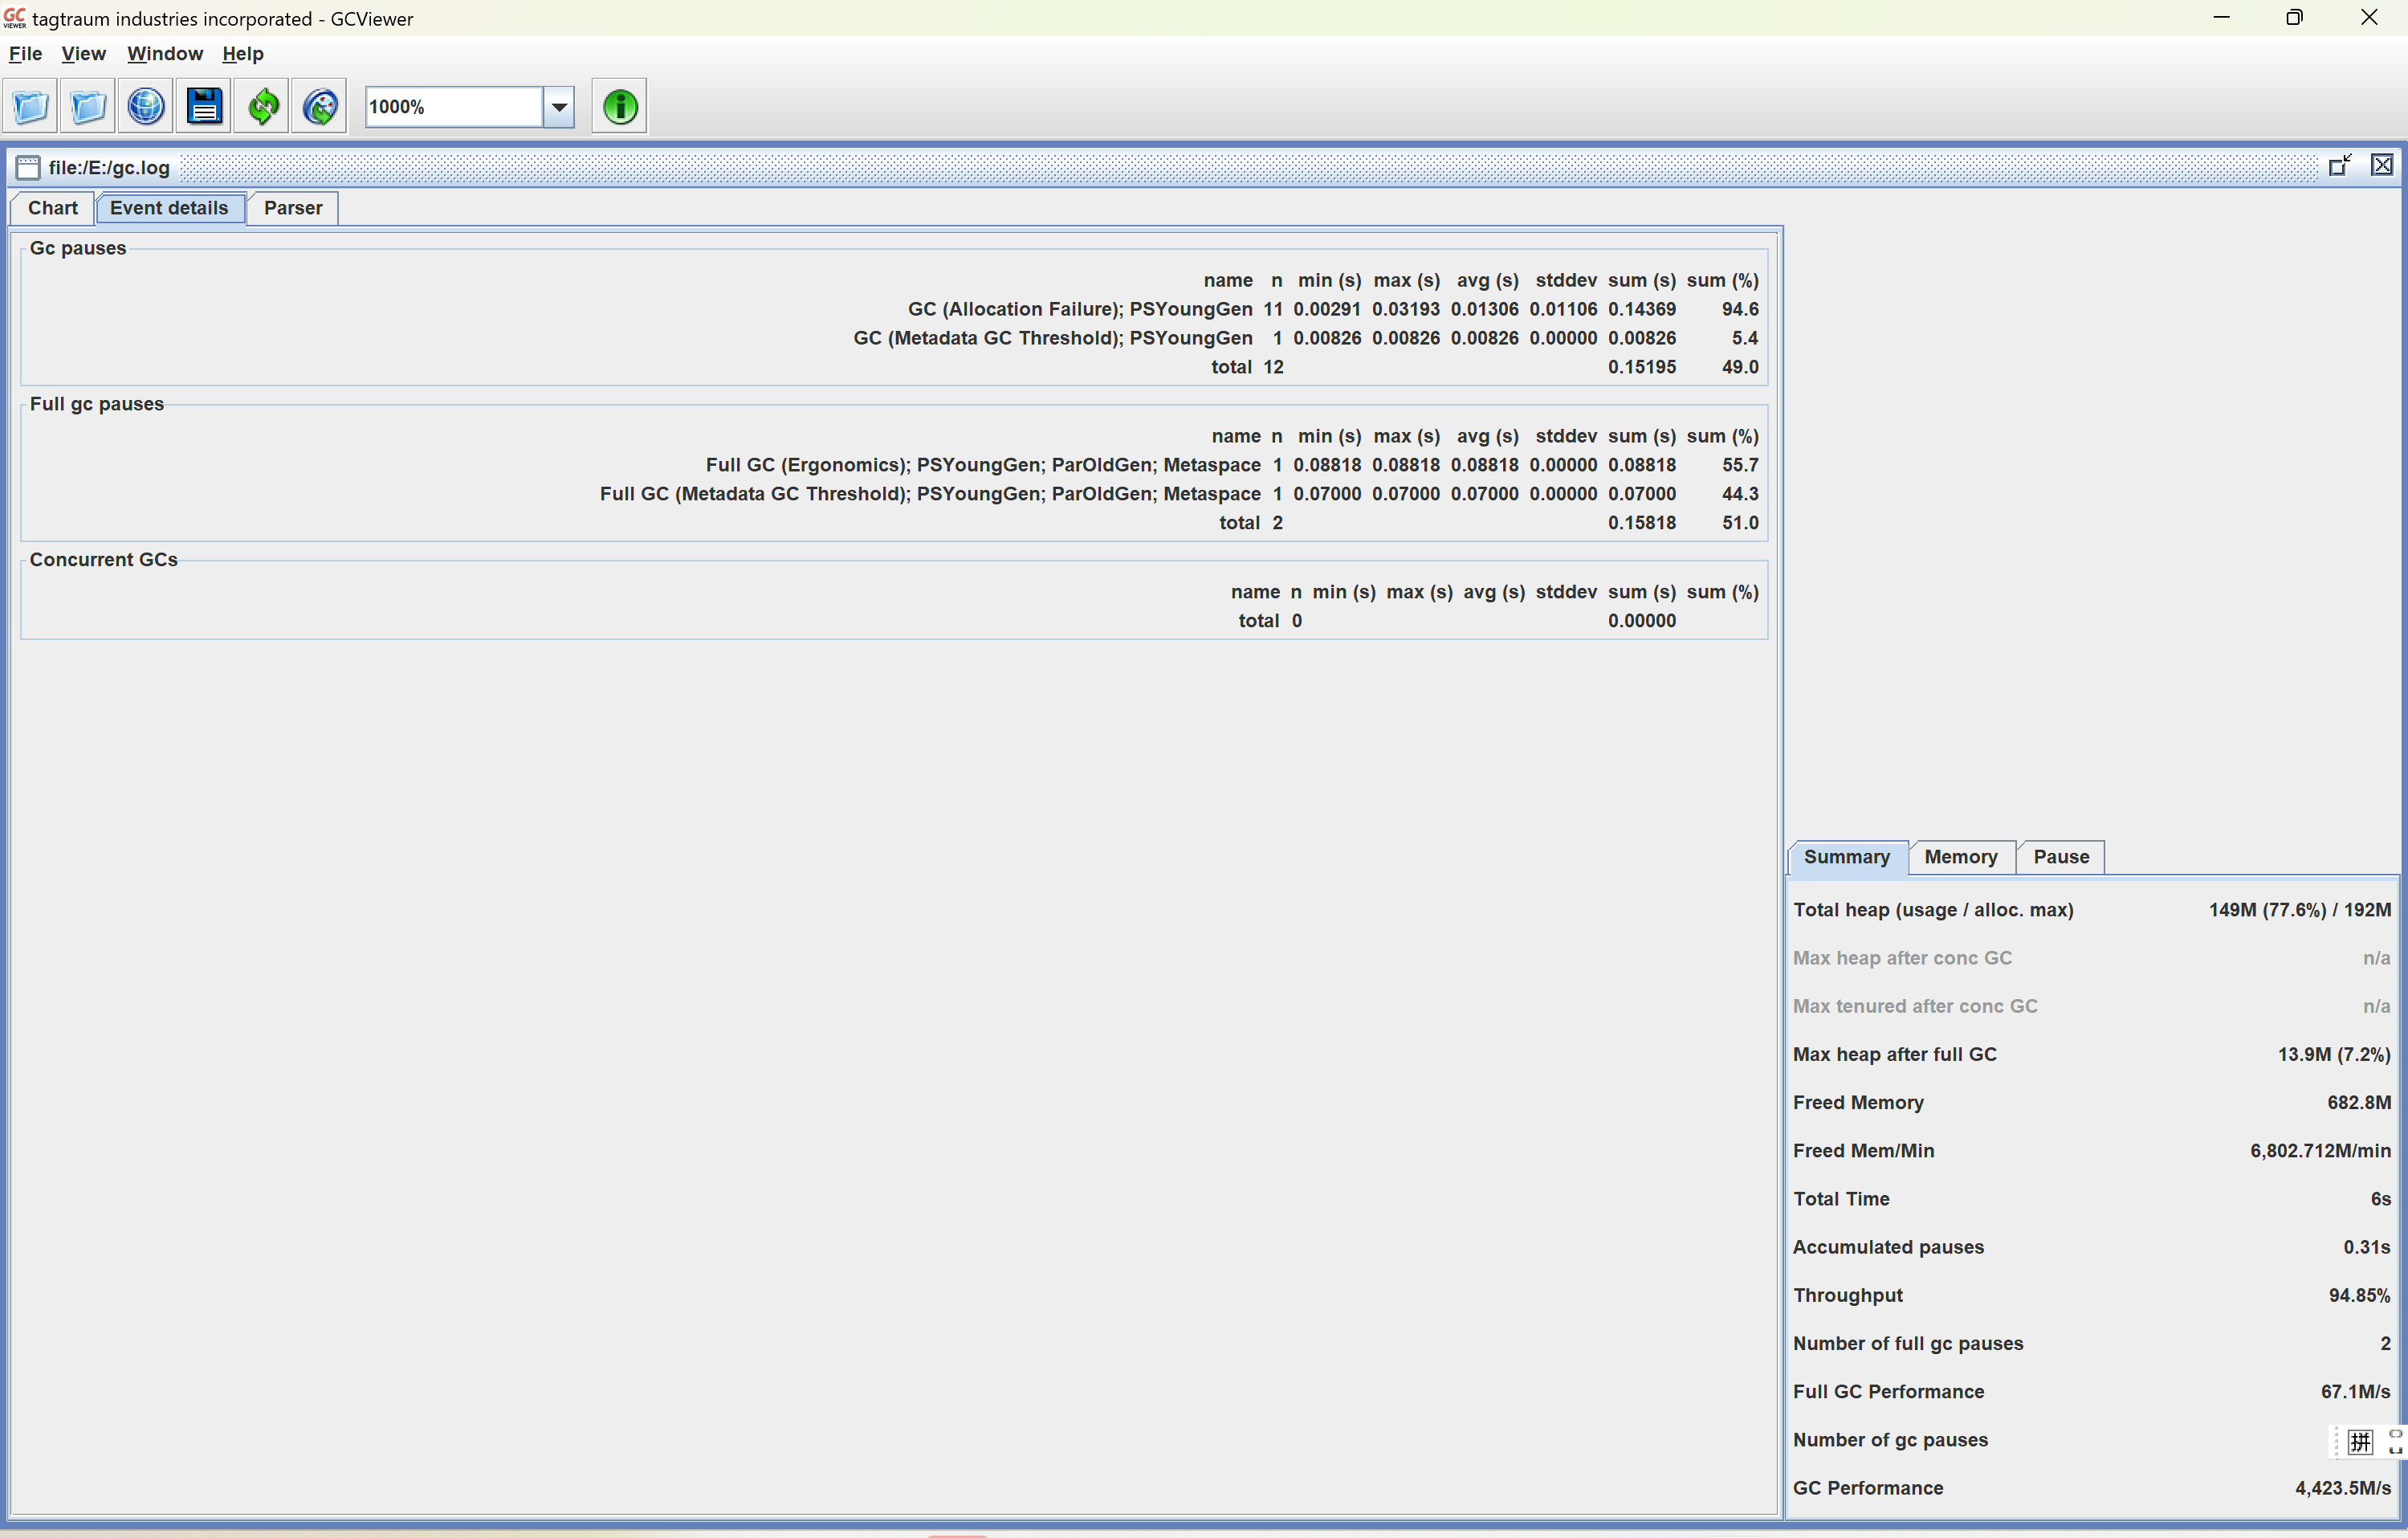
pause(停顿):分为 总的停顿,fullGC 停顿 ,Y GC 停顿
分析GC后买,如果关注是Thought ,则想办法提高。 如果关注的是停顿时间,则想办法怎么把停顿时间缩短
调整参数后,需要去记录每一次的:吞吐量 ,最小/最大停顿,平均停顿,Fgc次数,Ygc次数,这样可以做对比看,哪一次参数符合期望目标
演示2; 看 metaspace 的错误
1、启动java程序 MetaspaceSize 设置32M, 下方出现 Exception in thread "SpringContextShutdownHook" java.lang.OutOfMemoryError: Metaspace
[root@demo]# java -XX:MetaspaceSize=32M -XX:MaxMetaspaceSize=32M -jar gtest-obf.jar
_ _
| | (_)
__ _ _______ ___| |__ _
/ _` |_ / __/ __| '_ \| |
| (_| |/ / (__\__ \ |_) | |
\__, /___\___|___/_.__/| |
| | _/ |
|_| |__/
作者微信:ren168632201
__ ____ _____ ____ _____ _____ _____ _____ __
/ | / ___|| _ | / ___||____ |/ __ \/ __ \| _ |/ |
_ __ ___ _ __ `| | / /___ \ V / / /___ / /`' / /'`' / /'| |/' |`| |
| '__/ _ \ '_ \ | | | ___ \ / _ \ | ___ \ \ \ / / / / | /| | | |
| | | __/ | | || |_| \_/ || |_| || \_/ |.___/ /./ /___./ /___\ |_/ /_| |_
|_| \___|_| |_\___/\_____/\_____/\_____/\____/ \_____/\_____/ \___/ \___/
https://www.cnblogs.com/uncleyong/
192.168.117.180 -2025-05-28 17:51:02.424 INFO [main]com.qzcsbj.gift.GiftApplication.logStarting:55 -Starting GiftApplication v0.0.1-SNAPSHOT using Java 1.8.0_211 on qzcsbj with PID 6002 (/root/demo/gift-0.0.1-SNAPSHOT-obf.jar started by root in /root/demo)
"192.168.117.180 -2025-05-28 17:51:02.429 INFO [main]com.qzcsbj.gift.GiftApplication.logStartupProfileInfo:662 -No active profile set, falling back to default profiles: default
"192.168.117.180 -2025-05-28 17:51:04.652 INFO [main]o.s.boot.web.embedded.tomcat.TomcatWebServer.initialize:108 -Tomcat initialized with port(s): 18089 (http)
"192.168.117.180 -2025-05-28 17:51:04.670 INFO [main]org.apache.coyote.http11.Http11NioProtocol.log:173 -Initializing ProtocolHandler ["http-nio-18089"]
"192.168.117.180 -2025-05-28 17:51:04.672 INFO [main]org.apache.catalina.core.StandardService.log:173 -Starting service [Tomcat]
"192.168.117.180 -2025-05-28 17:51:04.673 INFO [main]org.apache.catalina.core.StandardEngine.log:173 -Starting Servlet engine: [Apache Tomcat/9.0.44]
"Exception in thread "main" java.lang.reflect.InvocationTargetException
at sun.reflect.NativeMethodAccessorImpl.invoke0(Native Method)
at sun.reflect.NativeMethodAccessorImpl.invoke(NativeMethodAccessorImpl.java:62)
at sun.reflect.DelegatingMethodAccessorImpl.invoke(DelegatingMethodAccessorImpl.java:43)
at java.lang.reflect.Method.invoke(Method.java:498)
at org.springframework.boot.loader.MainMethodRunner.run(MainMethodRunner.java:49)
at org.springframework.boot.loader.Launcher.launch(Launcher.java:107)
at org.springframework.boot.loader.Launcher.launch(Launcher.java:58)
at org.springframework.boot.loader.JarLauncher.main(JarLauncher.java:88)
Caused by: java.lang.OutOfMemoryError: Metaspace
Exception in thread "SpringContextShutdownHook" java.lang.OutOfMemoryError: Metaspace
2、重新 设置 MetaspaceSize 大一点 ,启动java程序 ,就没有报错了
[root@demo]# java -XX:MetaspaceSize=128M -XX:MaxMetaspaceSize=128M -jar gift-0.0.1-SNAPSHOT-obf.jar

 浙公网安备 33010602011771号