
matlab创建GUI
方法1:使用GUIDE菜单式操作
在matlab中输入guide,可以打开guide创建GUI的图形界面,按菜单操作即可
注:matlab未来版本可能会取消掉这种方式
方法2:编写代码创建GUI
下面是一个简单的以代码方式创建GUI的例子,其中关键的一些点包括
1. 创建一个figure object作为container
2. 通过`uicontrol`创建container内的控件,通过`'Callback'`属性关联回调函数
3. 回调函数参数一般是由两部分组成`(source,eventdata,handles)`,分别表示引起回调产生的控件的handle和(点击)事件的数据
function simple_gui2
% SIMPLE_GUI2 Select a data set from the pop-up menu, then
% click one of the plot-type push buttons. Clicking the button
% plots the selected data in the axes.

% Create and then hide the UI as it is being constructed.
f = figure('Visible','off','Position',[360,200,450,285]);

% Construct the components.
hsurf = uicontrol('Style','pushbutton','String','Surf',...
'Position',[315,220,70,25],...
'Callback',{@surfbutton_Callback});
hmesh = uicontrol('Style','pushbutton',...
'String','Mesh','Position',[315,180,70,25],...
'Callback',@meshbutton_Callback);
hcontour = uicontrol('Style','pushbutton',...
'String','Contour','Position',[315,135,70,25],...
'Callback',@contourbutton_Callback);
htext = uicontrol('Style','text','String','Select Data',...
'Position',[325,90,60,15]);
hpopup = uicontrol('Style','popupmenu',...
'String',{'Peaks','Membrane','Sinc'},...
'Position',[300,50,100,25],...
'Callback',@popup_menu_Callback);
ha = axes('Units','pixels','Position',[50,60,200,185]);
align([hsurf,hmesh,hcontour,htext,hpopup],'Center','None');
% Initialize the UI.
% Change units to normalized so components resize automatically.
f.Units = 'normalized';
ha.Units = 'normalized';
hsurf.Units = 'normalized';
hmesh.Units = 'normalized';
hcontour.Units = 'normalized';
htext.Units = 'normalized';
hpopup.Units = 'normalized';
% Generate the data to plot.
peaks_data = peaks(35);
membrane_data = membrane;
[x,y] = meshgrid(-8:.5:8);
r = sqrt(x.^2+y.^2) + eps;
sinc_data = sin(r)./r;
% Create a plot in the axes.
current_data = peaks_data;
surf(current_data);
% Assign a name to appear in the window title.
f.Name = 'Simple GUI';
% Move the window to the center of the screen.
movegui(f,'center')
% Make the UI visible.
f.Visible = 'on';

% Pop-up menu callback. Read the pop-up menu Value property to
% determine which item is currently displayed and make it the
% current data. This callback automatically has access to
% current_data because this function is nested at a lower level.
  function popup_menu_Callback(source,eventdata)
  % Determine the selected data set.
  str = source.String;
  val = source.Value;
  % Set current data to the selected data set.
  switch str{val};
  case 'Peaks' % User selects Peaks.
    current_data = peaks_data;
  case 'Membrane' % User selects Membrane.
    current_data = membrane_data;
  case 'Sinc' % User selects Sinc.
    current_data = sinc_data;
  end
  end

% Push button callbacks. Each callback plots current_data in the
% specified plot type.
  function surfbutton_Callback(source,eventdata)
  % Display surf plot of the currently selected data.
  surf(current_data);
  end
  function meshbutton_Callback(source,eventdata)
  % Display mesh plot of the currently selected data.
  mesh(current_data);
  end
  function contourbutton_Callback(source,eventdata)
  % Display contour plot of the currently selected data.
  contour(current_data);
  end
end
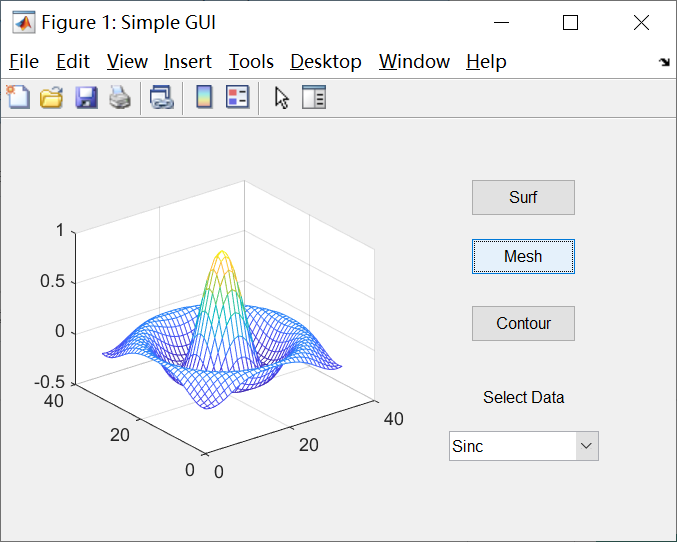
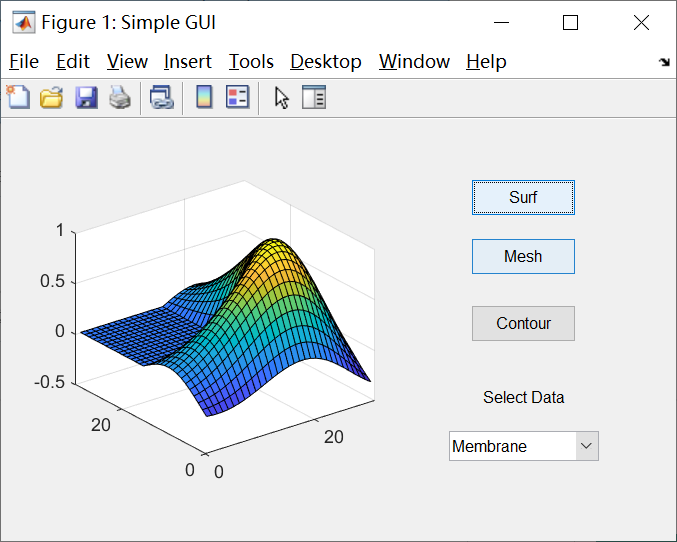
GUI展示
方法3:利用AppDesigner
和方法一的Guide类似
总结
我们有三种不同方式在matlab中创建简单的GUI程序,其中比较推荐的是使用编程的方式。GUI编程的主要思想是面向对象编程,每个对象有自己的方法和属性,我们可以通过对象的句柄操作该对象,在GUI编程中还往往用到事件(比如点击事件)和回调函数,某一事件发生时,GUI内部调用相应的回调函数,从而展示新的输入,达到交互式的效果,当然在更复杂的GUI系统中还需要更多精细的设计

 浙公网安备 33010602011771号