


一、检查系统日志
检查系统错误登陆日志,统计IP重试次数
# 这里使用了lastb命令,该命令需要root权限,可以显示所有登陆信息。这里仅仅显示的root用户的,读者可以更具实际情况自行确定,或者直接全部都显示,你会有不一样的收获,每个人的脚本都不一样,更具实际情况自行编写。
# lastb root | awk '{print $3}' | sort | uniq -c | sort -nr| more
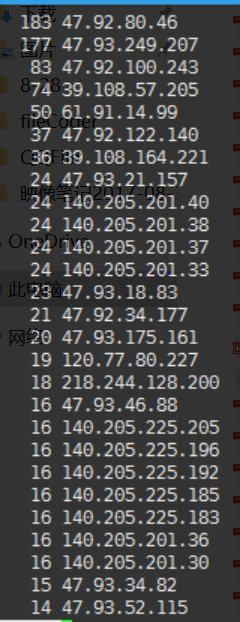
以下是我部署在阿里云上主机被多次扫描的日志
isadmin ssh:notty 121.42.165.44 Mon Aug 7 23:56 - 23:56 (00:00)
deploy ssh:notty 121.42.165.44 Mon Aug 7 23:54 - 23:54 (00:00)
deploy ssh:notty 121.42.165.44 Mon Aug 7 23:54 - 23:54 (00:00)
vagrant ssh:notty 121.42.165.44 Mon Aug 7 23:51 - 23:51 (00:00)
vagrant ssh:notty 121.42.165.44 Mon Aug 7 23:51 - 23:51 (00:00)
Iqadmin ssh:notty 121.42.165.44 Mon Aug 7 23:47 - 23:47 (00:00)
Iqadmin ssh:notty 121.42.165.44 Mon Aug 7 23:47 - 23:47 (00:00)
debian ssh:notty 121.42.165.44 Mon Aug 7 23:45 - 23:45 (00:00)
debian ssh:notty 121.42.165.44 Mon Aug 7 23:45 - 23:45 (00:00)
gpadmin ssh:notty 121.42.165.44 Mon Aug 7 23:43 - 23:43 (00:00)
gpadmin ssh:notty 121.42.165.44 Mon Aug 7 23:43 - 23:43 (00:00)
oracle ssh:notty 121.42.165.44 Mon Aug 7 23:40 - 23:40 (00:00)
oracle ssh:notty 121.42.165.44 Mon Aug 7 23:40 - 23:40 (00:00)
tomovic ssh:notty 121.42.165.44 Mon Aug 7 23:38 - 23:38 (00:00)
tomovic ssh:notty 121.42.165.44 Mon Aug 7 23:38 - 23:38 (00:00)
nginx ssh:notty 185.56.146.16 Mon Aug 7 23:37 - 23:37 (00:00)
nginx ssh:notty 185.56.146.16 Mon Aug 7 23:36 - 23:36 (00:00)
root ssh:notty 121.42.165.44 Mon Aug 7 23:36 - 23:36 (00:00)
root ssh:notty 121.42.165.44 Mon Aug 7 23:34 - 23:34 (00:00)
aaa ssh:notty 121.42.165.44 Mon Aug 7 23:12 - 23:12 (00:00)
aaa ssh:notty 121.42.165.44 Mon Aug 7 23:12 - 23:12 (00:00)
通过检测,我们可以发现可以得到该恶意ip,然后添加到过滤名单中
二、检查系统用户
1、cat /etc/passwd 查看是否有异常的系统用户
2、grep “0” /etc/passwd 查看是否产生了新用户,UID和GID为0的用户
3、ls -l /etc/passwd 查看passwd的修改时间,判断是否在不知的情况下添加用户
4、查看是否存在特权用户 awk -F":" '{if($3 == 0){print $1}}' /etc/passwd
5、查看是否存在空口令帐户 awk -F: '{if(length($2)==0) {print $1}}' /etc/passwd
三、检查系统异常进程
1、注意UID为0的进程 使用ps -ef命令查看进程
2、察看该进程所打开的端口和文件 lsof -p pid命令查看
3、检查隐藏进程# ps -ef | awk '{print $2}'| sort -n | uniq >1 ls /proc |sort -n|uniq >2 diff 1 2
“linux即文件,所有的进程在/proc均有记录,需要注意,这里的信息是最详细的,一些系统指令可能会出现被替换的的问题。”
四、检查系统异常文件
# find / -uid 0 -perm 4000 -print
# find / -size +10000k –print
# find / -name “…” –print
# find / -name “.. ” –print
# find / -name “. ” –print
# find / -name ” ” –print
注意SUID文件,可疑大于10M和空格文件
# find / -name core -exec ls -l {} \ (检查系统中的core文件)find -perm 高级用法
-perm mode:文件许可正好符合mode
-perm +mode:文件许可部分符合mode
-perm -mode: 文件许可完全符合mode
五、检查系统文件的完整性
# rpm –qf /bin/ls
# rpm -qf /bin/login
# md5sum –b 文件名
# md5sum –t 文件名
六、检查系统安装包的完整性(这里主要检验的rpm包)
# rpm –Va 输出格式:
S – File size differs
M – Mode differs (permissions)
5 – MD5 sum differs
D – Device number mismatch
L – readLink path mismatch
U – user ownership differs
G – group ownership differs
T – modification time differs
注意相关的 /sbin, /bin, /usr/sbin, and /usr/bin
对于不同的linux系统,你需要根据实际情况进行检查。
七、检查网络
# ip link | grep PROMISC(正常网卡不该在promisc混杂模式,可能存在sniffer)
网卡处于混杂模式,这样通过网卡的流量都会被监听
# lsof –i 如查看所有打开80端口的进程: lsof –i :80
查看恶意程序开放的端口
# netstat –nap(察看不正常打开的TCP/UDP端口)# arp –a 查看流量在内网是否被劫持
八、检查系统计划任务
注意root和UID是0的schedule
# crontab –u root –l
# cat /etc/crontab
# ls /etc/cron.*
九、检查系统后门
# cat /etc/crontab
# ls /var/spool/cron/
# cat /etc/rc.d/rc.local
# ls /etc/rc.d # ls /etc/rc3.d
# find / -type f -perm 4000
十、检查系统服务
# chkconfig —list
# rpcinfo -p(查看RPC服务)
这个主要检测的是启动服务,目前在centos7以上都采用systemd 来管理相应的服务。Systemd是一个系统管理守护进程、工具和库的集合,用于取代System V初始进程。Systemd的功能是用于集中管理和配置类UNIX系统。
查看所有的可用单元
# systemctl list-unit-files
十一、检查rootkit
# rkhunter -c
# chkrootkit -q
年纪大了,记忆力越来越差,有些东西还是记下来比较好。
转载请注明

 浙公网安备 33010602011771号