

vue组件之echarts报表
vue组件之echarts报表
将echarts报表封装成组件,动态传入数据,显示图表。
1.饼状图
父组件:
<MPie :datas="piedata"></MPie> <!--piedata为传入的数据-->
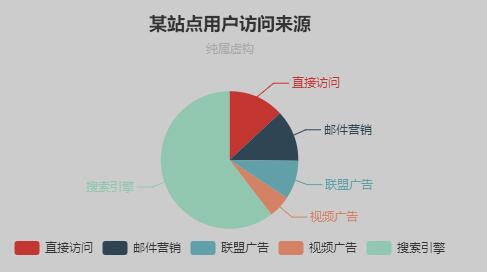
data:function(){
  return {
piedata:{
  htmldiv:'mycharts2',
  text: '某站点用户访问来源',
  subtext: '纯属虚构',
  name: '访问来源',
  data:[
    {value:335, name:'直接访问'},
    {value:310, name:'邮件营销'},
    {value:234, name:'联盟广告'},
    {value:135, name:'视频广告'},
    {value:1548, name:'搜索引擎'}
      ]
    }
  }
}
子组件:MPie.vue


<template>
  <div id="MPie">
    <div :id="datas.htmldiv" style="height:100%;width:100%;min-height: 250px;"></div>
  </div>
</template>

<script>
  var echarts = require('echarts')
export default {
  name: 'MPie',
  data () {
    return {
    }
  },
  mounted(){
    var legendData=[];
    for(var i in this.datas.data){
      legendData.push(this.datas.data[i])
    }
    var option = {
      title : {
        text: this.datas.text,
        textStyle:{color:'#333'},
        subtext: this.datas.subtext,
        subtextStyle:{color:'#aaa'},
        x:'center'
      },
      tooltip : {
        trigger: 'item',
        formatter: "{a} <br/>{b} : {c} ({d}%)"
      },
      legend: {
        orient: 'vertical',
        bottom: 'bottom',
        data: legendData
      },
      series : [
        {
          name: '访问来源',
          type: 'pie',
          radius : '55%',
          center: ['50%', '60%'],
          data:this.datas.data,
          itemStyle: {
            emphasis: {
              shadowBlur: 10,
              shadowOffsetX: 0,
              shadowColor: 'rgba(0, 0, 0, 0.5)'
            }
          }
        }
      ]
    };
    var myChart = echarts.init(document.getElementById(this.datas.htmldiv));
    myChart.setOption(option);
    window.onresize = echarts.getInstanceByDom(document.getElementById(this.datas.htmldiv)).resize();
  },
  methods: {

  },
  props: {
    datas: {}
  }
}
</script>

<!-- Add "scoped" attribute to limit CSS to this component only -->
<style scoped>

</style>
2.柱状图

父组件:
<MBar :datas="bardata"></MBar><!--piedata为传入的数据-->
bardata:{
  htmldiv:'mycharts1',
  text: '某站点用户访问来源',
  subtext: '纯属虚构',
  xAxisData: ['Mon', 'Tue', 'Wed', 'Thu', 'Fri', 'Sat', 'Sun'],
  data:[120, 200, 150, 80, 70, 110, 130]
}
子组件:MBar.vue
<template>
  <div id="MBar" style="">
    <div :id="datas.htmldiv" style="height:100%;width:100%;min-height: 250px;"></div>
  </div>
</template>

<script>
  var echarts = require('echarts')
export default {
  name: 'MBar',
  data () {
    return {
    }
  },
  mounted(){
    var option = {
      title : {
        text: this.datas.text,
        textStyle:{color:'#333'},
        subtext: this.datas.subtext,
        subtextStyle:{color:'#aaa'},
        x:'center'
      },
      xAxis: {
        type: 'category',
        data: this.datas.xAxisData,
        axisLine:{
          lineStyle:{
            color:'#000',
          }
        }
      },
      yAxis: {
        type: 'value',
        axisLine:{
          lineStyle:{
            color:'#000',
          }
        }
      },
      grid:{
        bottom:20,
        left:40,
        right:20,
        top:50
      },
      series: [{
        data: this.datas.data,
        type: 'bar'
      }]
    };
    var myChart = echarts.init(document.getElementById(this.datas.htmldiv));
    myChart.setOption(option);
    window.onresize = echarts.getInstanceByDom(document.getElementById(this.datas.htmldiv)).resize();
  },
  methods: {

  },
  props: {
    datas: {}
  }
}
</script>

<!-- Add "scoped" attribute to limit CSS to this component only -->
<style scoped>

</style>

 浙公网安备 33010602011771号