

MATLAB——颜色梯度显示
一、colormap函数
figure
surf(peaks)
 k=1000;
 mycolor=spring(k);
colormap(mycolor);
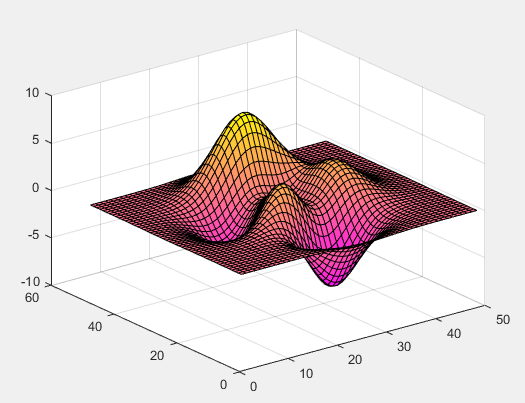
spring是颜色的分类。spring(k)生成k个梯度的渐变颜色值。
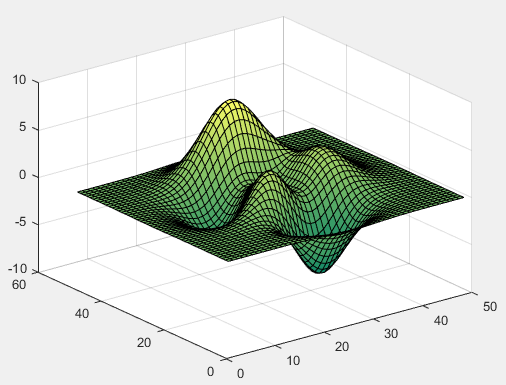
figure
surf(peaks)
colormap summer
二、colorbar函数
(1)
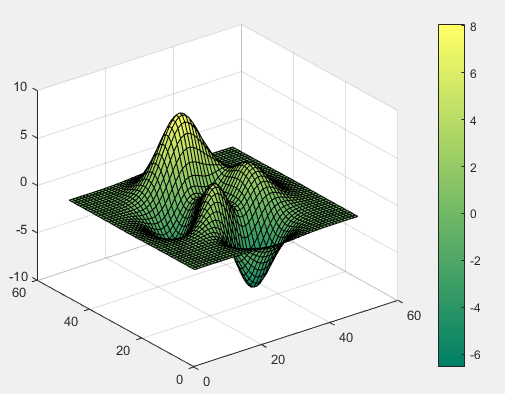
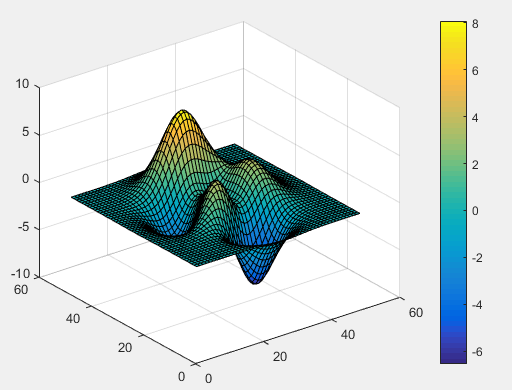
figure
surf(peaks)
colormap summer
colorbar
(2)调整colorbar颜色
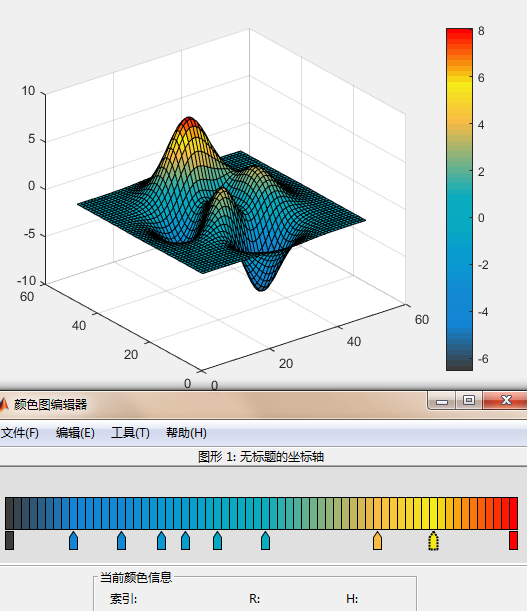
figure
surf(peaks)
colormap
colorbar
在编辑中找到颜色编辑器
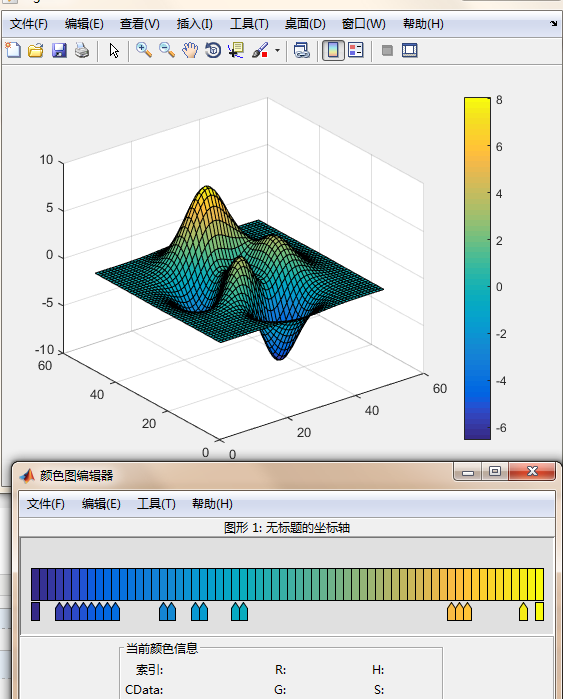
双击增加颜色块,delete减少颜色块,调整颜色即可
(3)位置调整和字体大小
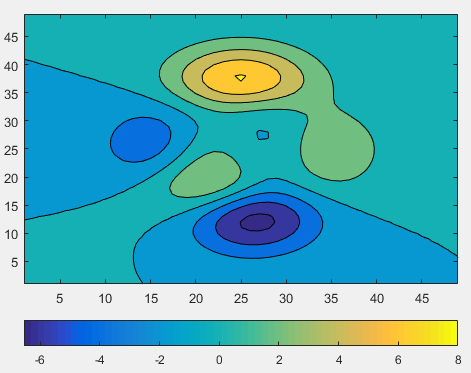
clear all
figure
contourf(peaks)
colorbar('southoutside')
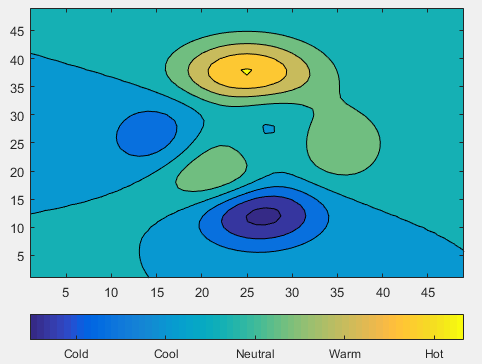
clear all
figure
contourf(peaks)
colorbar('southoutside','Ticks',[-5,-2,1,4,7],...
         'TickLabels',{'Cold','Cool','Neutral','Warm','Hot'})
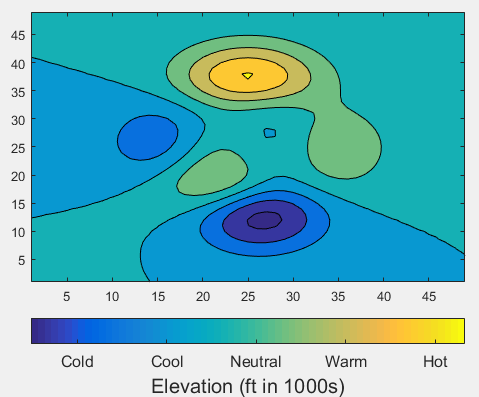
clear all
figure
contourf(peaks)
c=colorbar('southoutside','Ticks',[-5,-2,1,4,7],...
         'TickLabels',{'Cold','Cool','Neutral','Warm','Hot'},'fontsize',12)
c.Label.String = 'Elevation (ft in 1000s)';
c.Label.FontSize = 15;
(4)调整高度
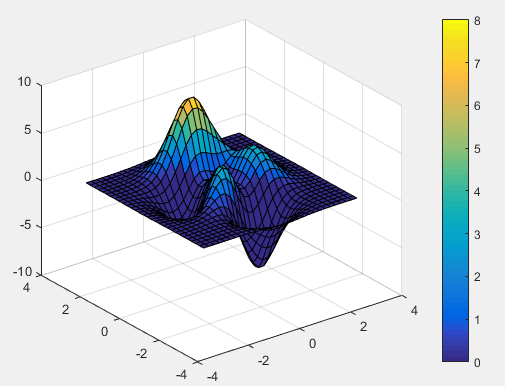
clear all
[X,Y,Z] = peaks(30);
surf(X,Y,Z)
colorbar
[cmin,cmax] = caxis
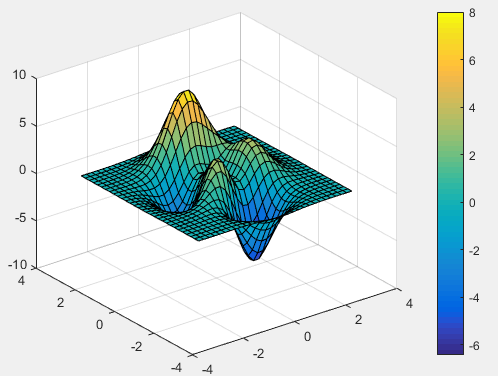
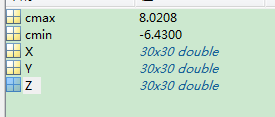
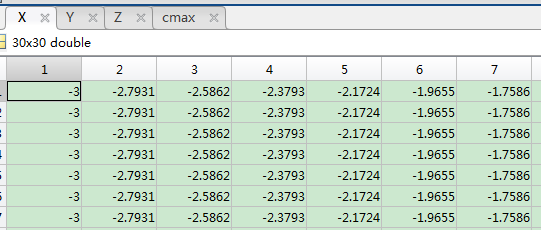
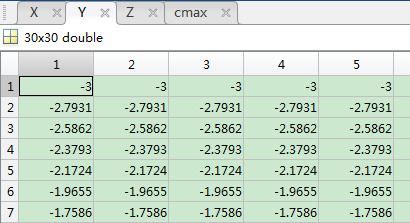
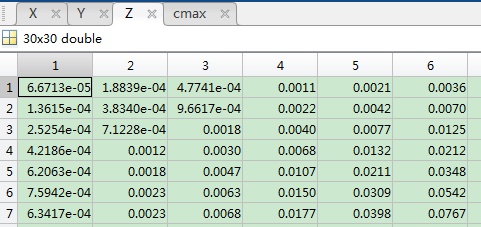
上面可以看到整个的数据组织形式,,x,y形成一个二维网格,z是对应点的高度,三维化就得到了如上的图,caxis找到极值点。
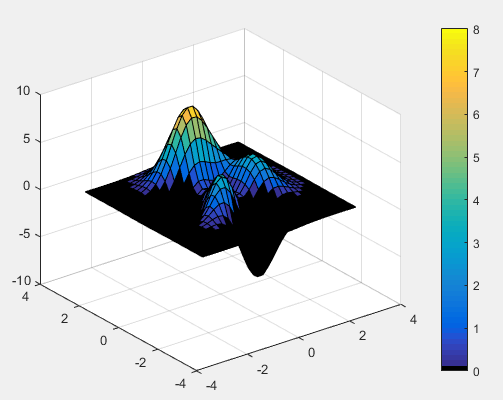
clear all
[X,Y,Z] = peaks(30);
surf(X,Y,Z)
colorbar
[cmin,cmax] = caxis
caxis([0,cmax])%改变颜色块的值
clear all
[X,Y,Z] = peaks(30);
surf(X,Y,Z)
colorbar
[cmin,cmax] = caxis
caxis([0,cmax])

%将0以下的由深蓝变成黑色
map = colormap;
map(1,:) = [0 0 0];
colormap(map)

 浙公网安备 33010602011771号