import pandas as pd
import numpy as np
# 折线图
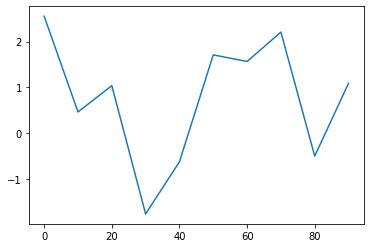
s=pd.Series(np.random.randn(10),index=np.arange(0,100,10))
s.plot()
<AxesSubplot:>
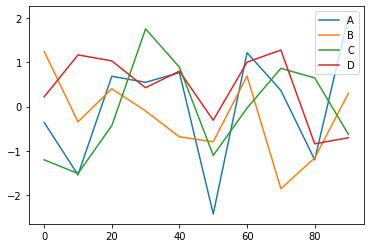
df=pd.DataFrame(np.random.randn(10,4),index=np.arange(0,100,10),columns=list('ABCD'))
print(df)
df.plot()
           A         B         C         D
0  -0.358499  1.242513 -1.200230  0.218051
10 -1.540113 -0.344976 -1.509415  1.162260
20  0.680961  0.398406 -0.429856  1.027732
30  0.545883 -0.101128  1.747935  0.423187
40  0.763575 -0.682698  0.885915  0.796835
50 -2.419253 -0.794231 -1.100932 -0.309591
60  1.212027  0.684612 -0.035615  0.999927
70  0.362055 -1.851297  0.860120  1.271996
80 -1.199978 -1.158961  0.644087 -0.840503
90  2.033464  0.301777 -0.629141 -0.702707


<AxesSubplot:>
import matplotlib.pyplot as plt
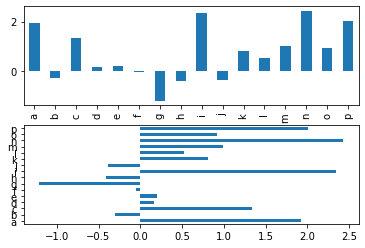
s=pd.Series(np.random.randn(16),index=list('abcdefghijklmnop'))
fig,aexs=plt.subplots(2,1)
# 垂直柱状图
s.plot(ax=aexs[0],kind='bar')
# 水平柱状图
s.plot(ax=aexs[1],kind='barh')
<AxesSubplot:>
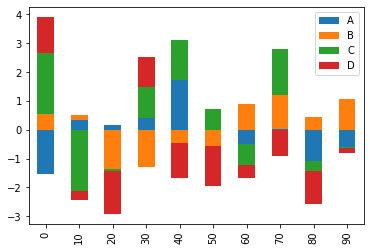
# 堆叠柱状图
df=pd.DataFrame(np.random.randn(10,4),index=np.arange(0,100,10),columns=list('ABCD'))
df.plot(kind='bar',stacked=True)
plt.show()
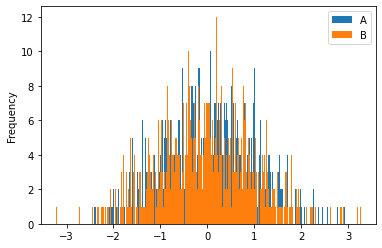
# hist直方图
df=pd.DataFrame({'A':np.random.randn(1000),'B':np.random.randn(1000)})
df.plot(kind='hist',bins=500)
plt.show()
df2=pd.DataFrame({'C':np.random.randn(1000)})
df3=pd.concat([df,df2],axis=1)
print(df3)
            A         B         C
0   -0.857916  1.603299 -0.584807
1   -0.192799 -0.824972  1.138644
2   -1.780869 -0.501384  1.318104
3    0.916919 -0.564578  0.832844
4   -0.153033 -0.381179 -0.122554
..        ...       ...       ...
995  0.188451 -0.763563  0.230478
996  0.371608 -0.946306  0.318904
997  0.299794 -0.420749  0.276406
998 -0.193156 -0.091357 -0.926047
999  0.871653  1.204641 -1.030529

[1000 rows x 3 columns]
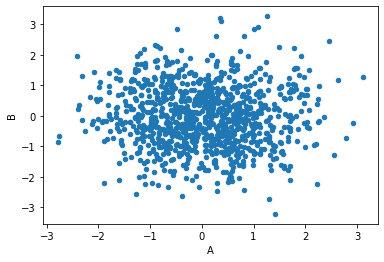
# 散点图
data=df3[['A','B','C']]
data.plot.scatter('A','B')
<AxesSubplot:xlabel='A', ylabel='B'>
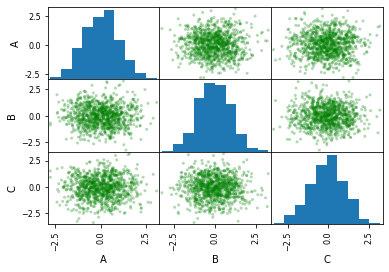
pd.plotting.scatter_matrix(data,color='g',alpha=0.3)
array([[<AxesSubplot:xlabel='A', ylabel='A'>,
        <AxesSubplot:xlabel='B', ylabel='A'>,
        <AxesSubplot:xlabel='C', ylabel='A'>],
       [<AxesSubplot:xlabel='A', ylabel='B'>,
        <AxesSubplot:xlabel='B', ylabel='B'>,
        <AxesSubplot:xlabel='C', ylabel='B'>],
       [<AxesSubplot:xlabel='A', ylabel='C'>,
        <AxesSubplot:xlabel='B', ylabel='C'>,
        <AxesSubplot:xlabel='C', ylabel='C'>]], dtype=object)
