MATLAB 绘图
plot代码思路
固定画布大小
plot参数
颜色代码
线型代码
box排列 位置
子图
Case 0 函数绘图
syms x
y(x) = -0.255x+1.056x2-1.859*x3+1.241*x^4;
x = 0.09:0.01:0.7;
plot(x,y(x))
Case 1

Data source:
以上图为例
代码如下
Case 2
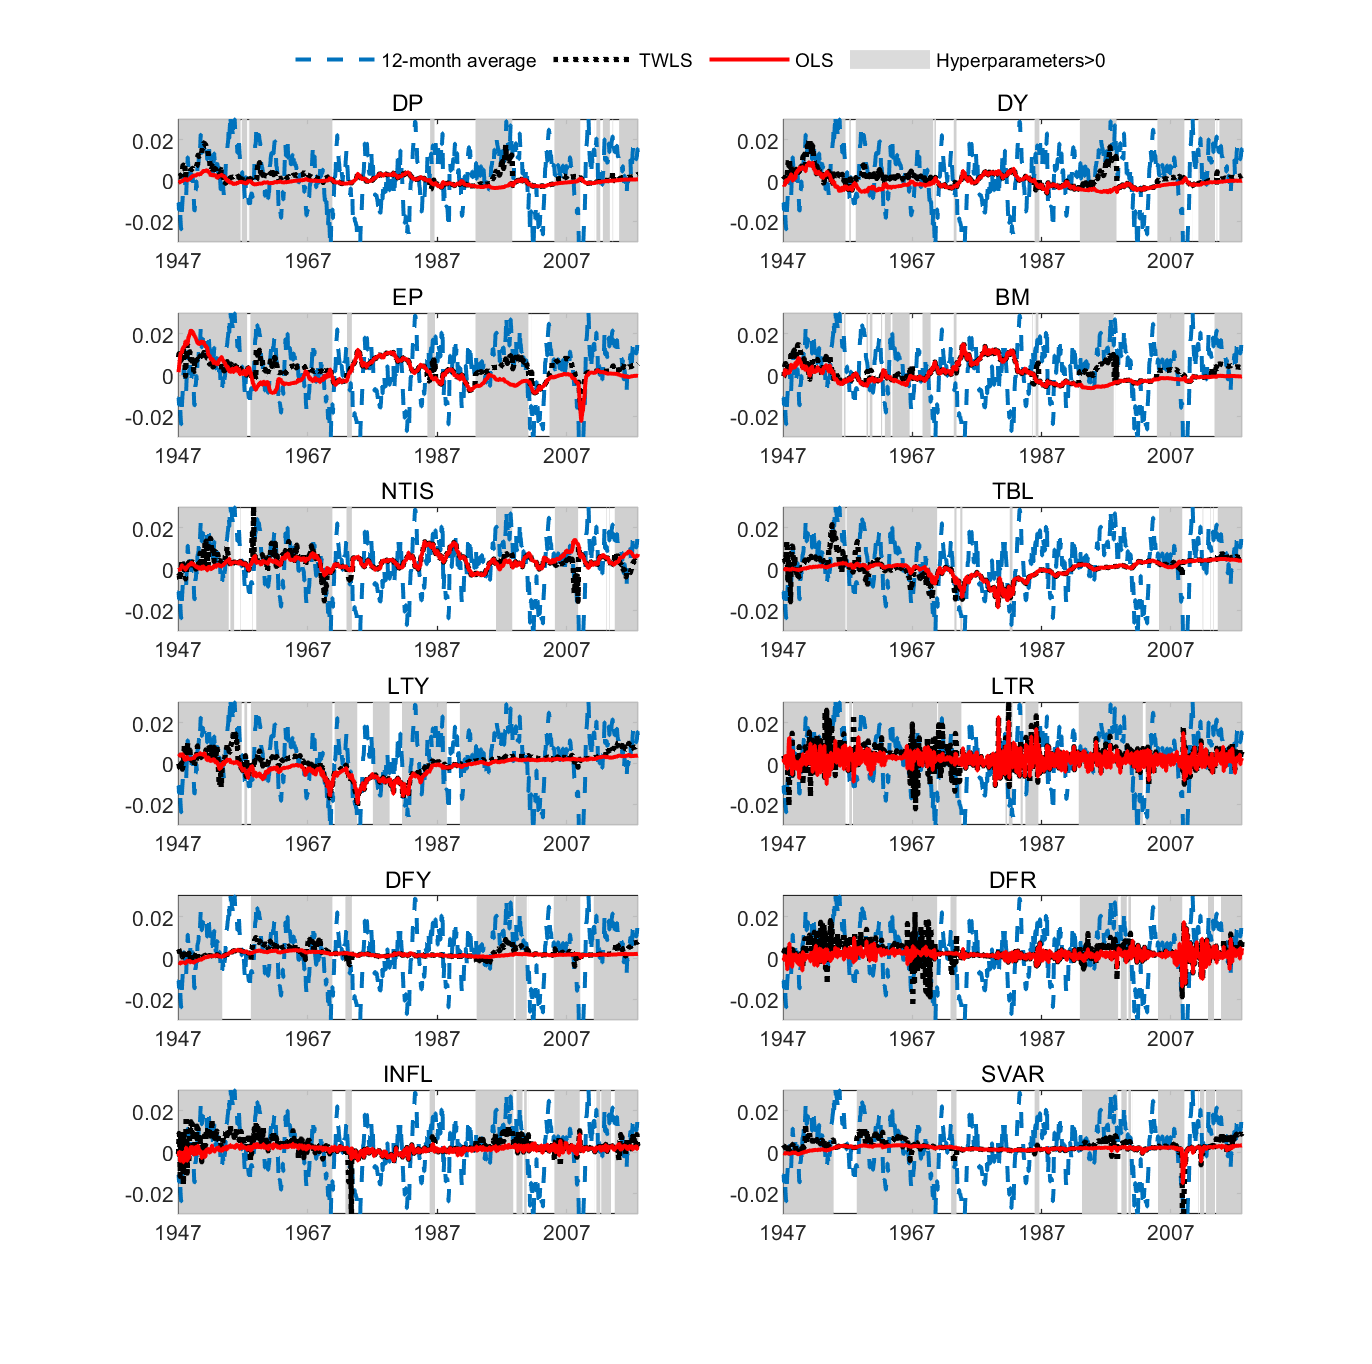
Tips
% 添加横坐标刻度和lable
set(gca,'XTick',[0 121 241 361 481 601 721 852 ],'XTickLabel',...
{'1947','1957','1967','1977','1987','1997','2007','2017'});
衰退期加阴影
recessionplot
参考 https://ww2.mathworks.cn/help/econ/recessionplot.html
% 绘图前日期转为datenum格式
dates = datenum([yyyy,mm,dd]);
% dates = datenum([yyyy,ones(size(yyyy,1),2)]);
figure;
plot(dates,X0,'LineWidth',2);
ax = gca;
ax.XTick = dates(1:2:end);
datetick('x','yyyy','keepticks')
xlabel('Date');
ylabel('Level');
axis tight;
recessionplot;
画趋势线
双纵坐标
yyaxis left
plot(dates,DOX_lambda2(:,2),'LineWidth',1.5)
ylim([0 1]);
yyaxis right
plot(dates,DOX_lambda2(:,3),'LineWidth',1.5)
% ylim([0 10]);
axis tight
ax = gca;
ax.XTick = dates(1:24:end);
datetick('x','yyyy','keepticks')
recessionplot;
legend('DOX','lambda(In sample)')
实例
实例1

[~, bull_col, ~] = intersect(Index.ym, bull02); % 满足条件所在行 交集
bull_dum = zeros(190-60,1);
bull_dum(bull_col,1) =1;

subplot(2,1,1)
yyaxis left
p0 = plot(Index.SHclsprc,'LineWidth',1.5,'Color',[0 0.447058826684952 0.74117648601532]);
hold on
yyaxis right
p2 = plot(Index.SZclsprc,'--','LineWidth',1.5,'Color','#B22222');
ipositive = [35 52];
iipositive={};
for j = 1:length(ipositive)/2
    iipositive{j}=ipositive(2*j-1):ipositive(2*j); % [连续的数字]
end
hold on
for k1 = 1:size(iipositive,2)
    q = iipositive{k1};
    if length(q) == 1
        q = [q q+0.1];
    end
    qx = [min(q) max(q)  max(q)  min(q)];
    yl = ylim;
    qy = [[1 1]*yl(1) [1 1]*yl(2)];
%     patch(qx, qy, [1 1 1]*0.8,'LineStyle','none','FaceAlpha',0.5) % 边框不显示
    p1 = patch(qx, qy, [1 1 1]*0.7,'EdgeAlpha',0,'FaceAlpha',0.6);
    %'EdgeAlpha',边框透明度,'FaceAlpha',阴影透明度)
end
yyaxis left
p0 = plot(Index.SHclsprc,'-','LineWidth',1.5,'Color',[0 0.447058826684952 0.74117648601532]);
hold on
yyaxis right
p2 = plot(Index.SZclsprc,'--','LineWidth',1.5,'Color','#B22222');
set(gca,'XTick',11:12:130,'XTickLabel',...
     {2012:2021});
hLegend = legend([p0,p2,p1],{'上证综指','深证综指','牛市:波峰波谷判定法'});
Position_hLegend = get(hLegend, 'Position');
set(hLegend, 'location','northoutside','NumColumns',4);
legend('boxoff')
axis tight;

subplot(2,1,2)
yyaxis left
p0 = plot(Index.SHclsprc,'LineWidth',1.5,'Color',[0 0.447058826684952 0.74117648601532]);
hold on
yyaxis right
p2 = plot(Index.SZclsprc,'--','LineWidth',1.5,'Color','#B22222');

positive = find(bull_dum(:,1)==1); % 返回行索引
ipositive=1;
for j = 1:length(positive)-1
    if positive(j+1,1) ~= positive(j,1)+1
        ipositive = [ipositive;positive(j);positive(j+1)];
    end
end
ipositive(length(ipositive)+1) = positive(end);

iipositive={};
for j = 1:length(ipositive)/2
    iipositive{j}=ipositive(2*j-1):ipositive(2*j); % [连续的数字]
end
hold on
for k1 = 1:size(iipositive,2)
    q = iipositive{k1};
    if length(q) == 1
        q = [q q+0.1];
    end
    qx = [min(q) max(q)  max(q)  min(q)];
    yl = ylim;
    qy = [[1 1]*yl(1) [1 1]*yl(2)];
%     patch(qx, qy, [1 1 1]*0.8,'LineStyle','none','FaceAlpha',0.5) % 边框不显示
    p1 = patch(qx, qy, [1 1 1]*0.7,'EdgeAlpha',0,'FaceAlpha',0.6);
    %'EdgeAlpha',边框透明度,'FaceAlpha',阴影透明度)
end
yyaxis left
p0 = plot(Index.SHclsprc,'-','LineWidth',1.5,'Color',[0 0.447058826684952 0.74117648601532]);
hold on
yyaxis right
p2 = plot(Index.SZclsprc,'--','LineWidth',1.5,'Color','#B22222');
set(gca,'XTick',11:12:130,'XTickLabel',...
     {2012:2021});
hLegend = legend([p0,p2,p1],{'上证综指','深证综指','牛市:市场平均收益判定法'});
Position_hLegend = get(hLegend, 'Position');
set(hLegend, 'location','northoutside','NumColumns',4);
legend('boxoff')
axis tight;

 浙公网安备 33010602011771号