
Hystrix仪表板介绍
Hystrix仪表板使您可以实时监视Hystrix指标。
可以使用此仪表板时,通过减少发现和恢复运营事件所需的时间来改善其运营。大多数生产事件的持续时间(由于Hystrix而已经不那么频繁了)变得更短了,并且影响减小了,这是由于Hystrix仪表板提供了对系统行为的实时洞察力。
Hystrix提供了对于微服务调用状态的监控信息,但是需要结合spring-boot-actuator模块一起使用。Hystrix Dashboard是Hystrix的一个组件,Hystrix Dashboard提供一个断路器的监控面板,可以使我们更好的监控服务和集群的状态
Hystrix仪表板使用
搭建Hystrix仪表板项目
1、新建项目(test-springcloud-hystrix7979),引入依赖:
1 <!-- hystrix-dashboard -->
2 <dependency>
3     <groupId>org.springframework.cloud</groupId>
4     <artifactId>spring-cloud-starter-netflix-hystrix-dashboard</artifactId>
5 </dependency>
2、编写application.yml配置文件
1 # 端口
2 server:
3   port: 7979
3、编写主启动类,并使用@EnableHystrixDashboard注解开启HystrixDashboard

1 // 开启HystrixDashboard
2 @EnableHystrixDashboard
3 @SpringBootApplication
4 public class HystrixMain7979 {
5     public static void main(String[] args) {
6         SpringApplication.run(HystrixMain7979.class, args);
7     }
8 }
4、启动项目
访问地址:http://localhost:7979/hystrix
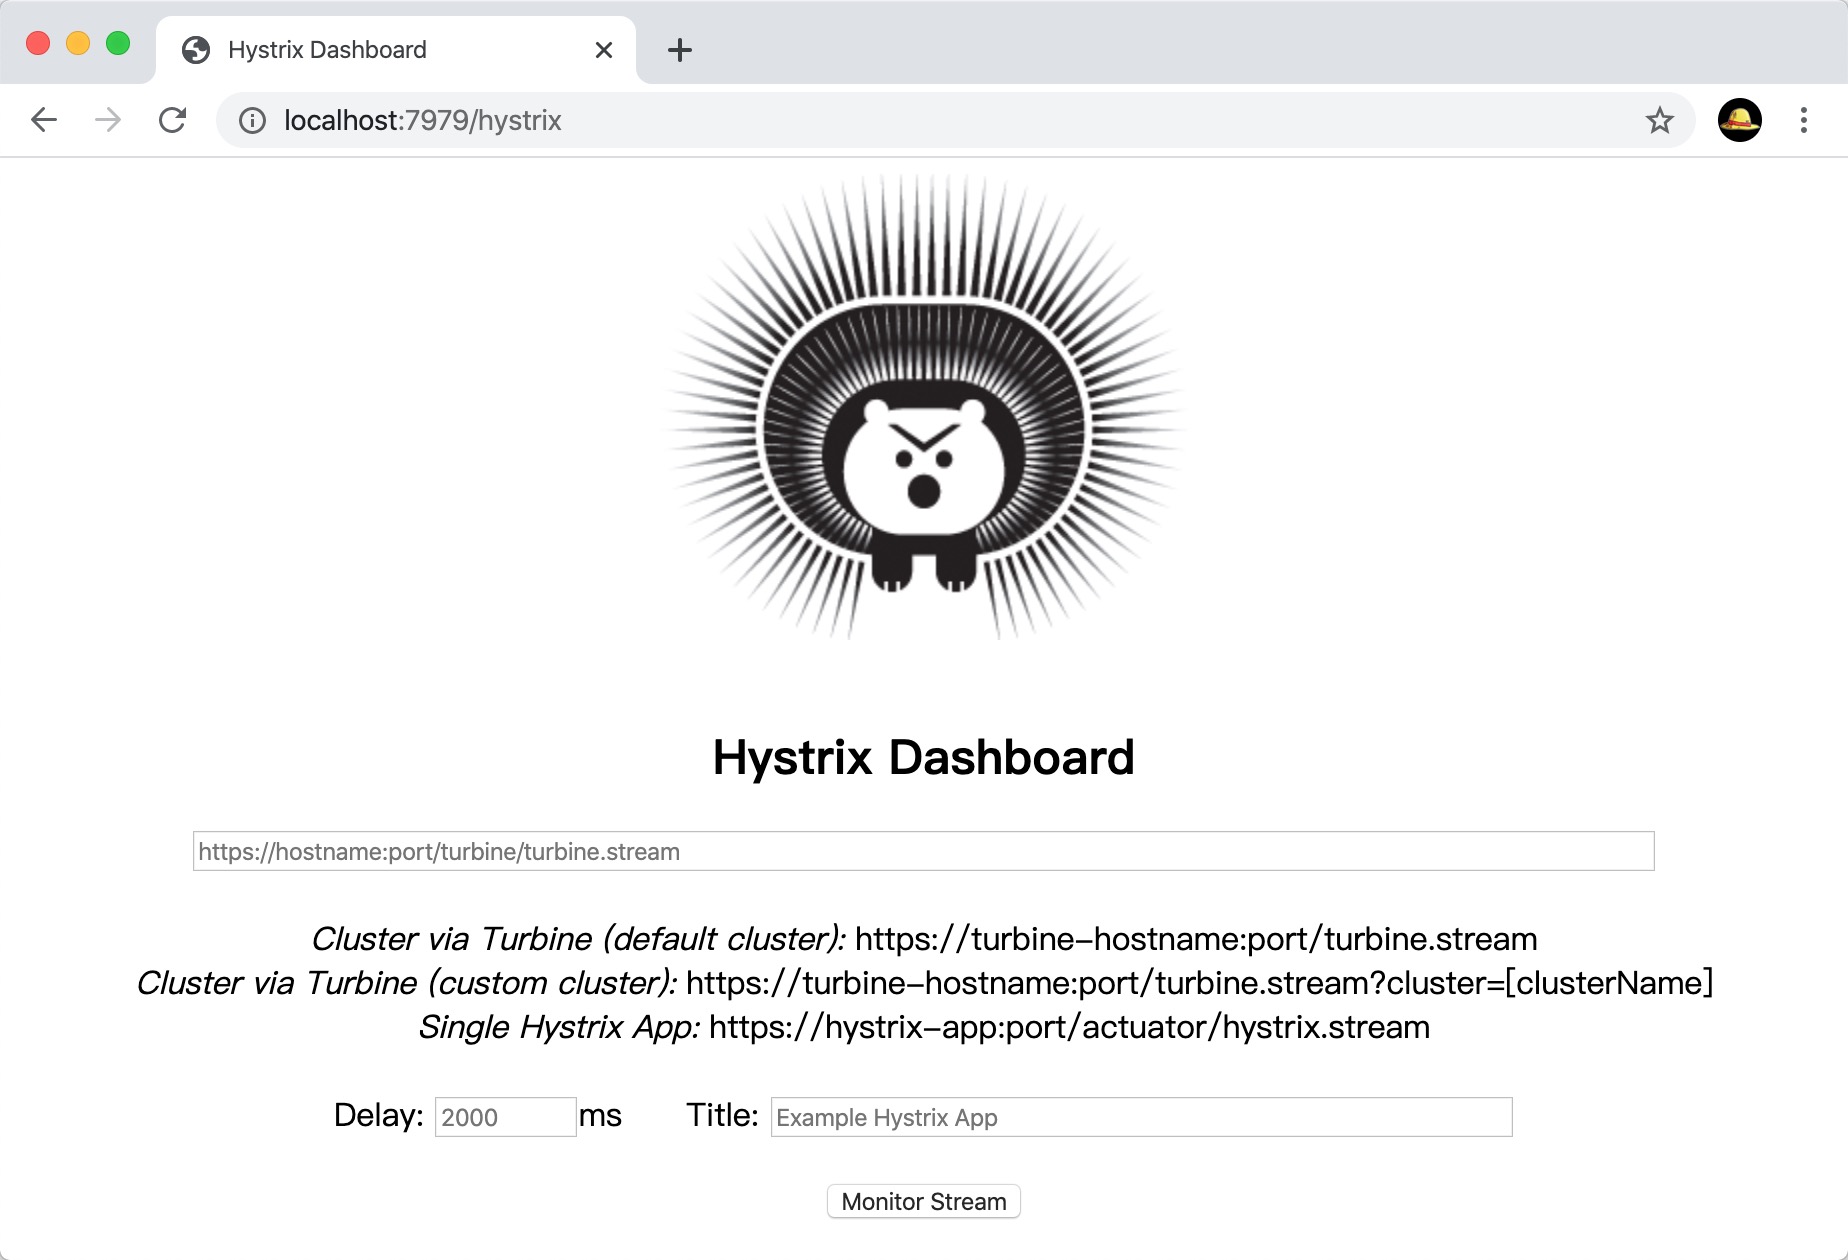
到此Hystrix仪表板项目,搭建完成
监控Hystrix服务项目
1、使用上一章的项目,确保在Hystrix服务项目(test-springcloud-provider-payment8008)中有依赖如下:
 1 <!-- hystrix -->
 2 <dependency>
 3     <groupId>org.springframework.cloud</groupId>
 4     <artifactId>spring-cloud-starter-netflix-hystrix</artifactId>
 5 </dependency>
 6
 7 <dependency>
 8     <groupId>org.springframework.boot</groupId>
 9     <artifactId>spring-boot-starter-actuator</artifactId>
10 </dependency>
2、在配置文件中新增以下内容,启动“hystrix.stream”端口
1 management:
2   endpoints:
3     web:
4       exposure:
5         include: health,info,hystrix.stream
3、启动项目测试
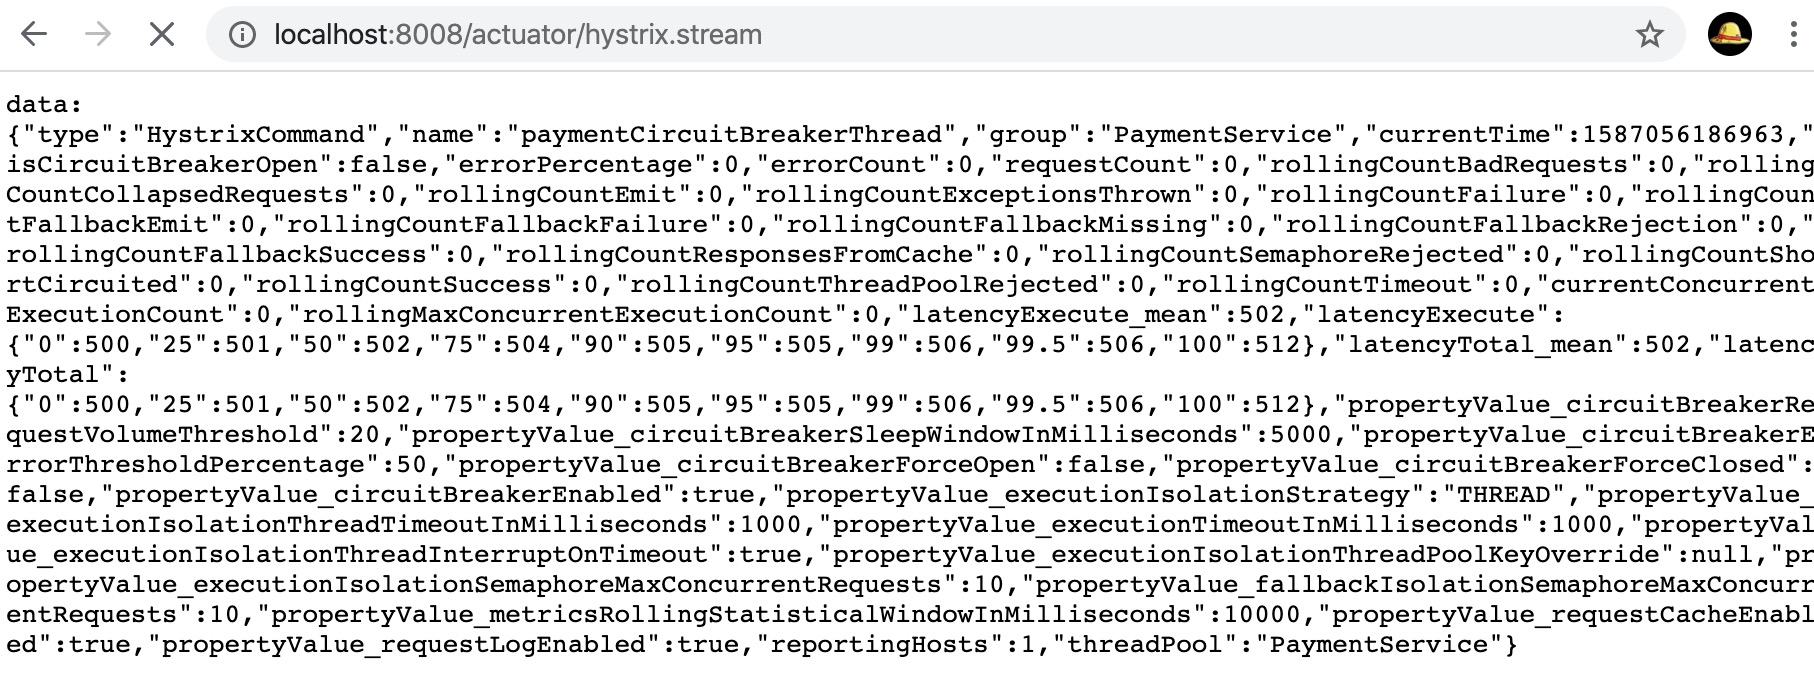
1)访问地址:http://localhost:8008/actuator/hystrix.stream,确保hystrix.stream端口开启
2)在Hystrix仪表板输入监控地址:http://localhost:8008/actuator/hystrix.stream
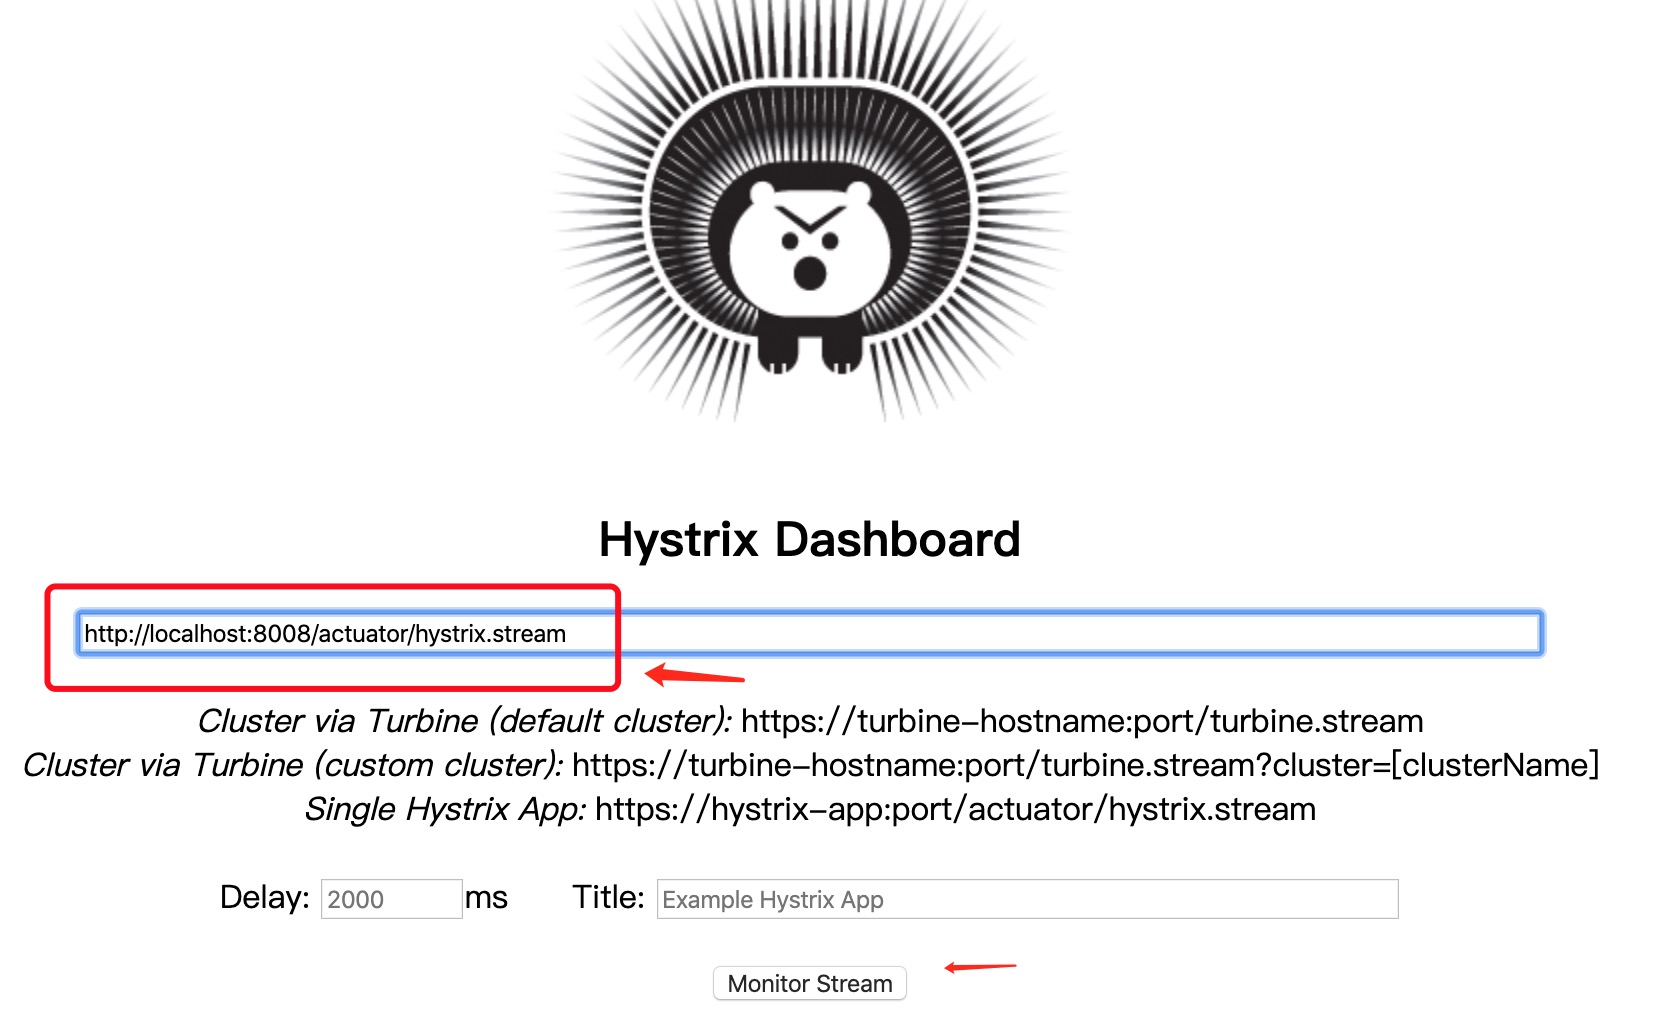
3)点击Monitor Stream,进入如下界面,使用JMeter请求Hystrix的服务:
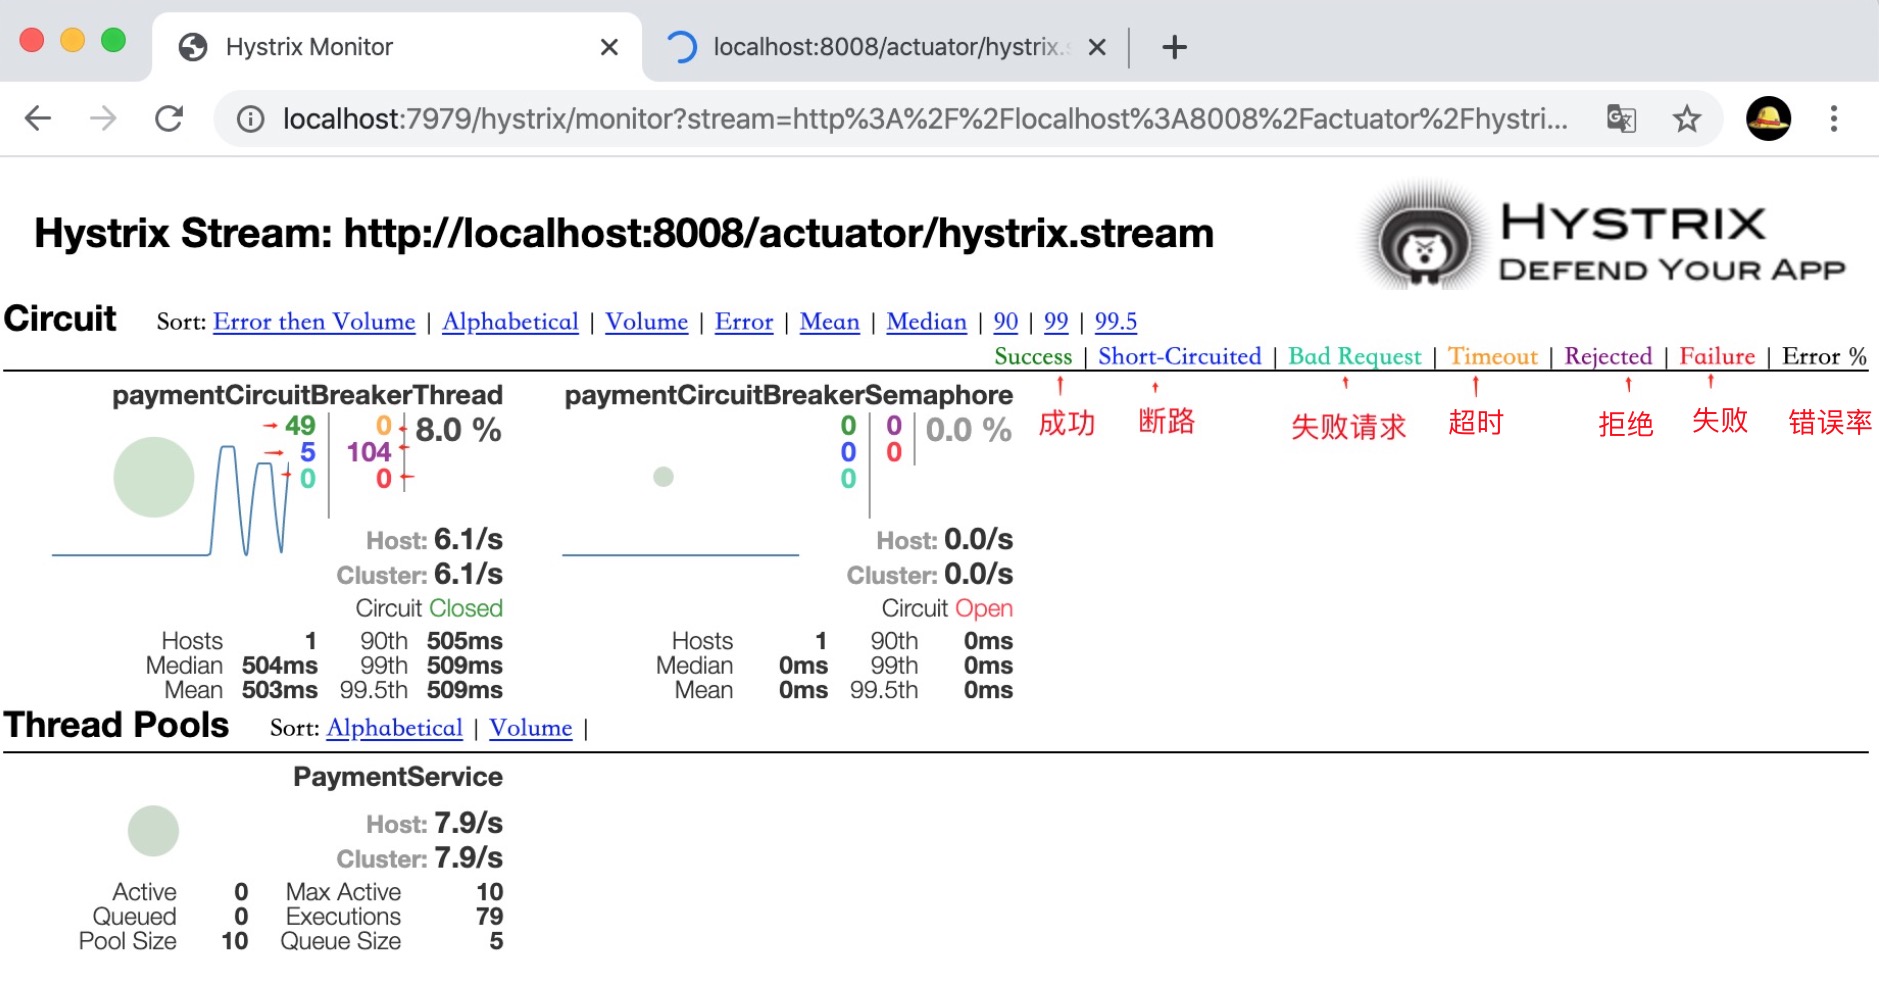
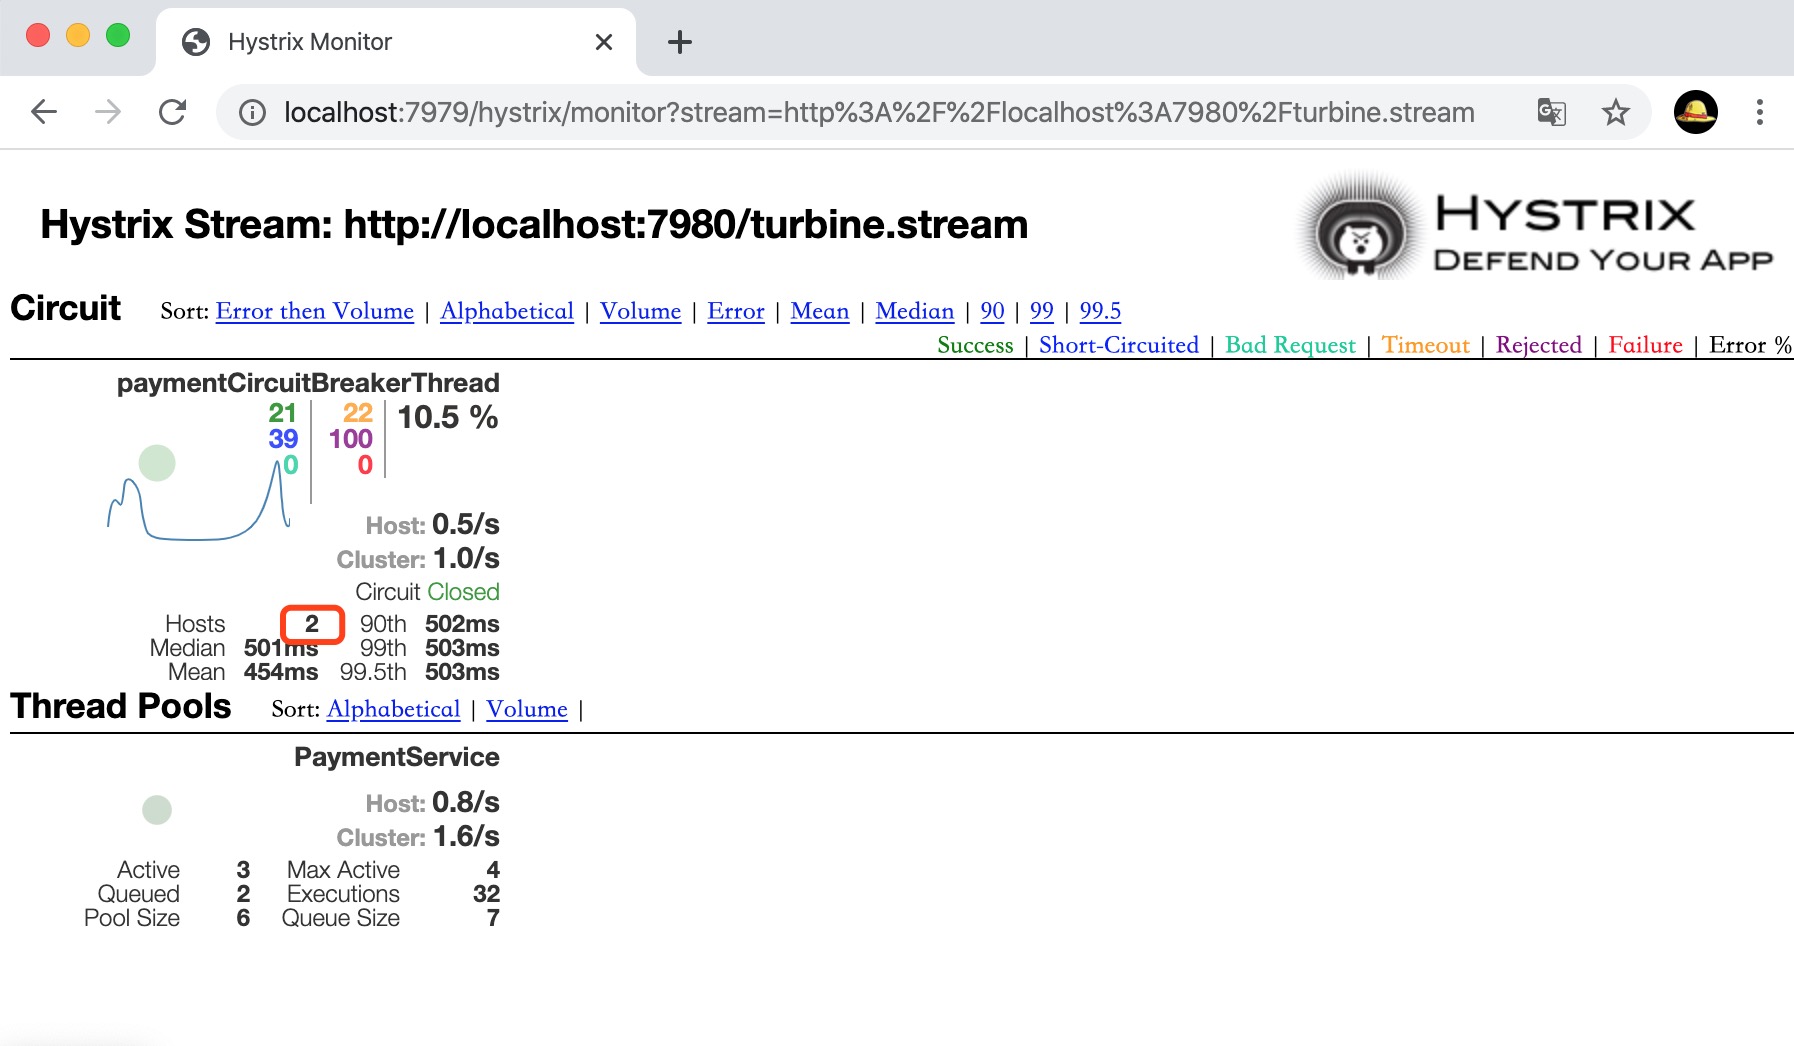
说明:
圆圈:健康颜色,从绿色、黄色、橙色、红色递减
圆圈:流量越大改实心圆越大
颜色数字:对于请求处理各个结果的统计值
Turbine服务
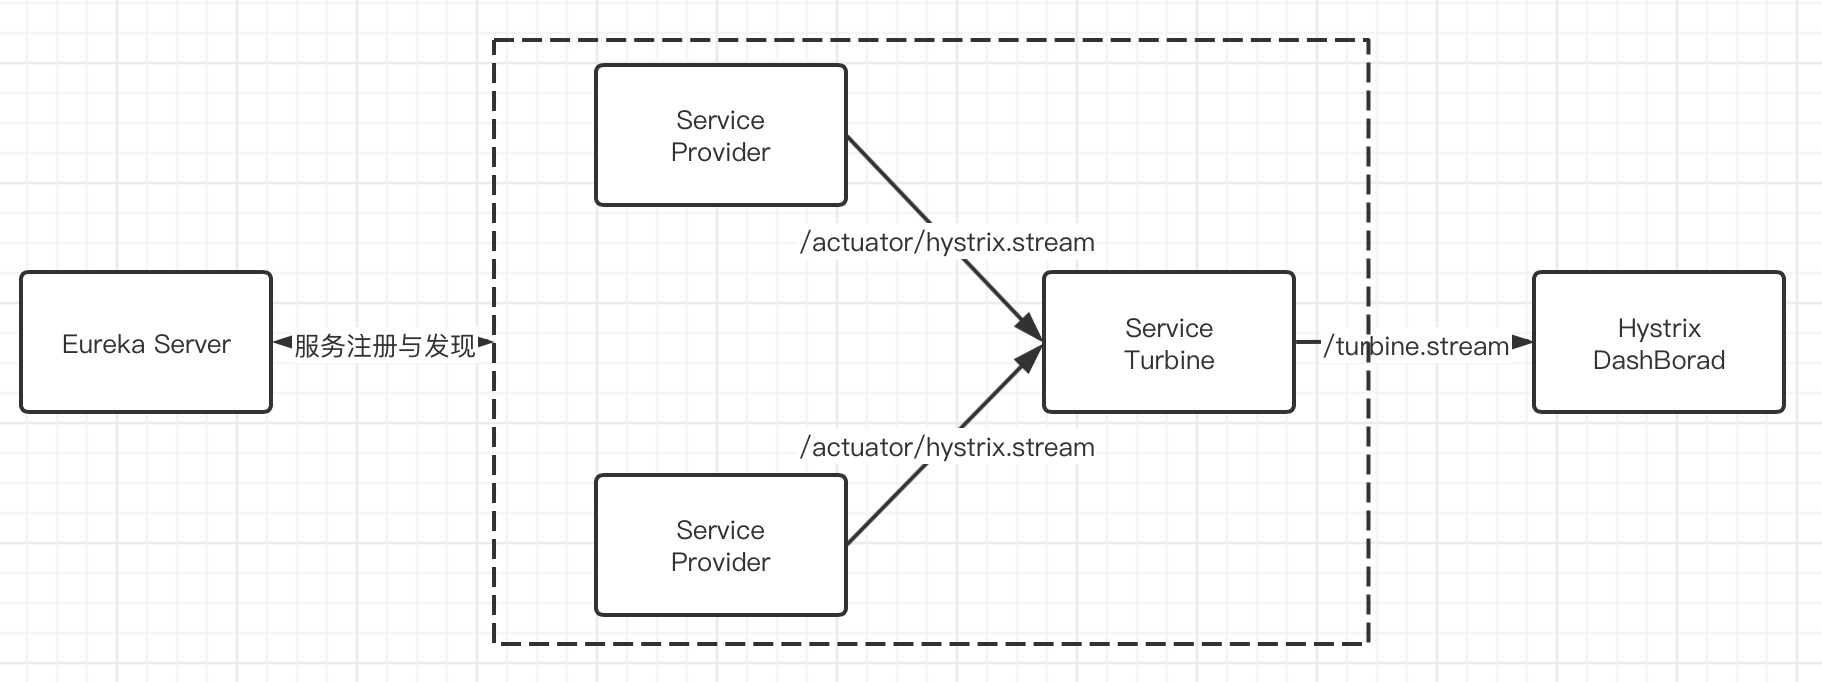
以上例子只能监控一个,要同时监控多个流,就需要做一个Turbine服务,专门监控所有断路器状态,从而掌握整个系统中所有微服务的状态。
通过Turbine来汇集监控信息,并将聚合后的信息提供给Hystrix Dashboard来集中展示和监控。
项目架构图如下:
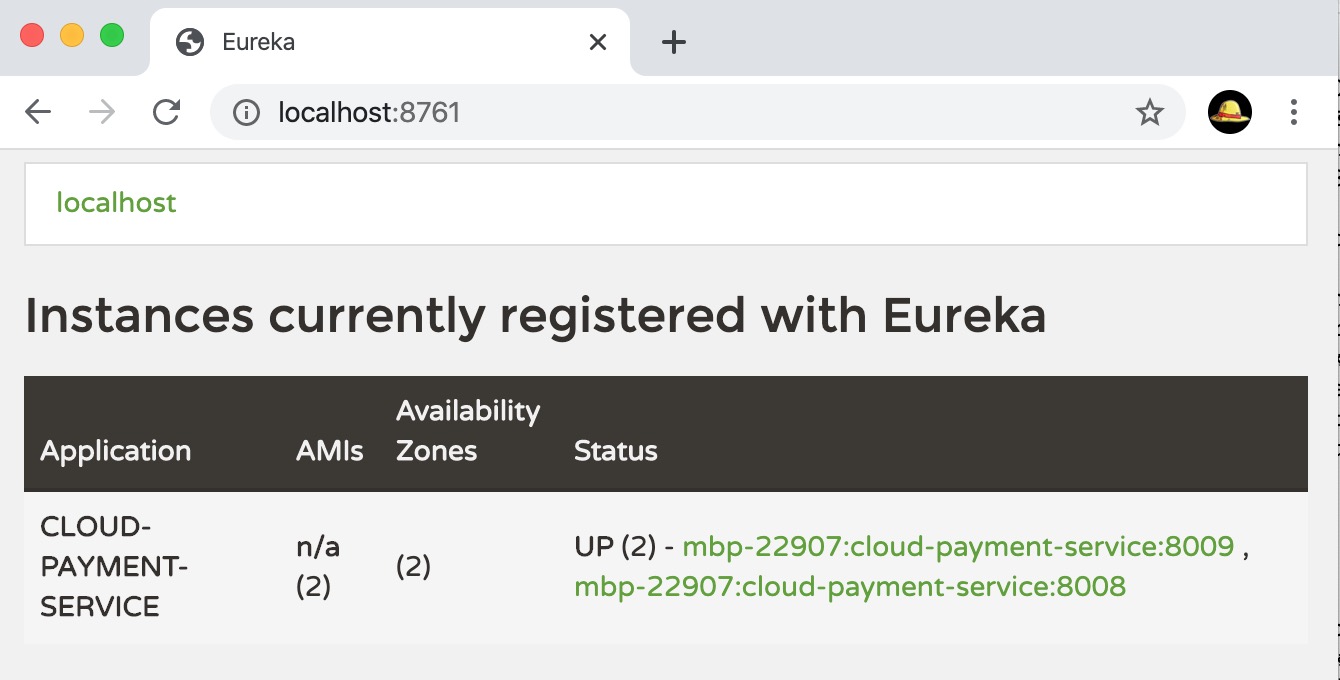
1、在上面实例的基础上,在新建一个Hystrix服务项目(test-springcloud-provider-payment8009),
保证与Hystrix服务项目(test-springcloud-provider-payment8008)相同,且服务的“hystrix.stream”端口,是启用的
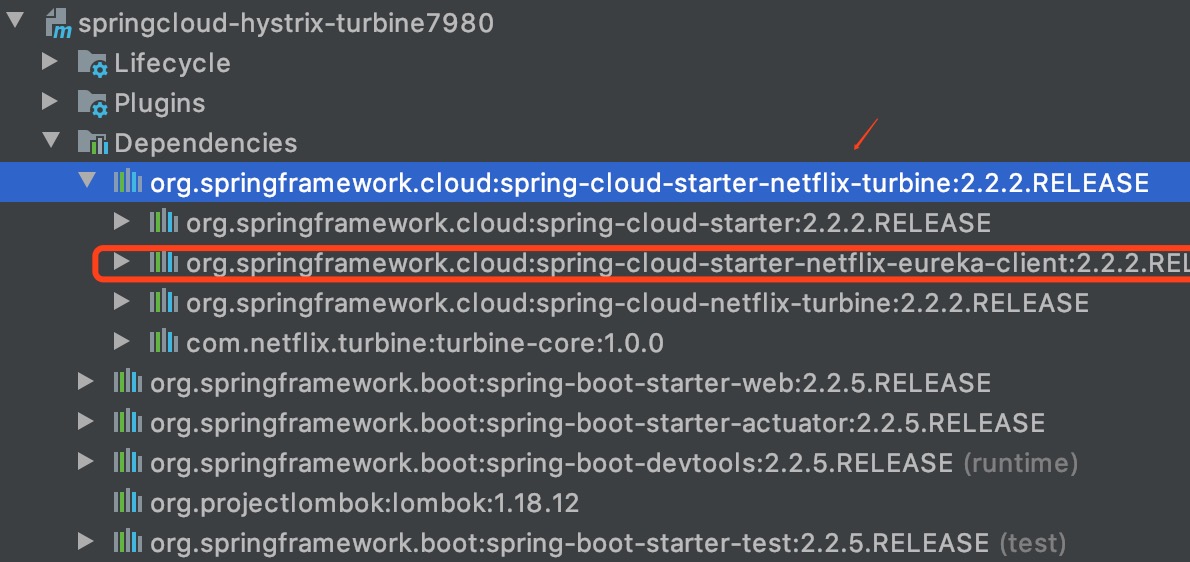
2、新建项目Turbine服务(springcloud-hystrix-turbine7980),引入Turbine依赖
1 <!-- hystrix-turbine -->
2 <dependency>
3     <groupId>org.springframework.cloud</groupId>
4     <artifactId>spring-cloud-starter-netflix-turbine</artifactId>
5 </dependency>
而Turbine依赖,集成了Eureka
完整POM如下:
 pom.xml
3、编辑配置文件application.yml
 1 # 端口
 2 server:
 3   port: 7980
 4
 5 spring:
 6   application:
 7     name: hystrix-turbine
 8
 9 eureka:
10   client:
11     register-with-eureka: true
12     fetch-registry: true
13     service-url:
14       defaultZone: http://localhost:8761/eureka
15
16 turbine:
17   # 配置Eureka中的serviceId列表,表明监控哪些服务,多个用逗号隔开
18   app-config: cloud-payment-service
19   aggregator:
20     cluster-config: default
21   cluster-name-expression: "'default'"
4、编写启动类,并使用注解@EnableTurbine,启用Turbine服务
1 // 启用Turbine服务
2 @EnableTurbine
3 @SpringBootApplication
4 public class Turbine7980 {
5     public static void main(String[] args) {
6         SpringApplication.run(Turbine7980.class, args);
7     }
8 }
5、测试
1)启动注册中心,启动Hystrix服务,启动Turbine服务,启动Hystrix-DashBorad
2)访问地址:http://localhost:8008/actuator/hystrix.stream
确保Hystrix服务的hystrix.stream 的端口启动
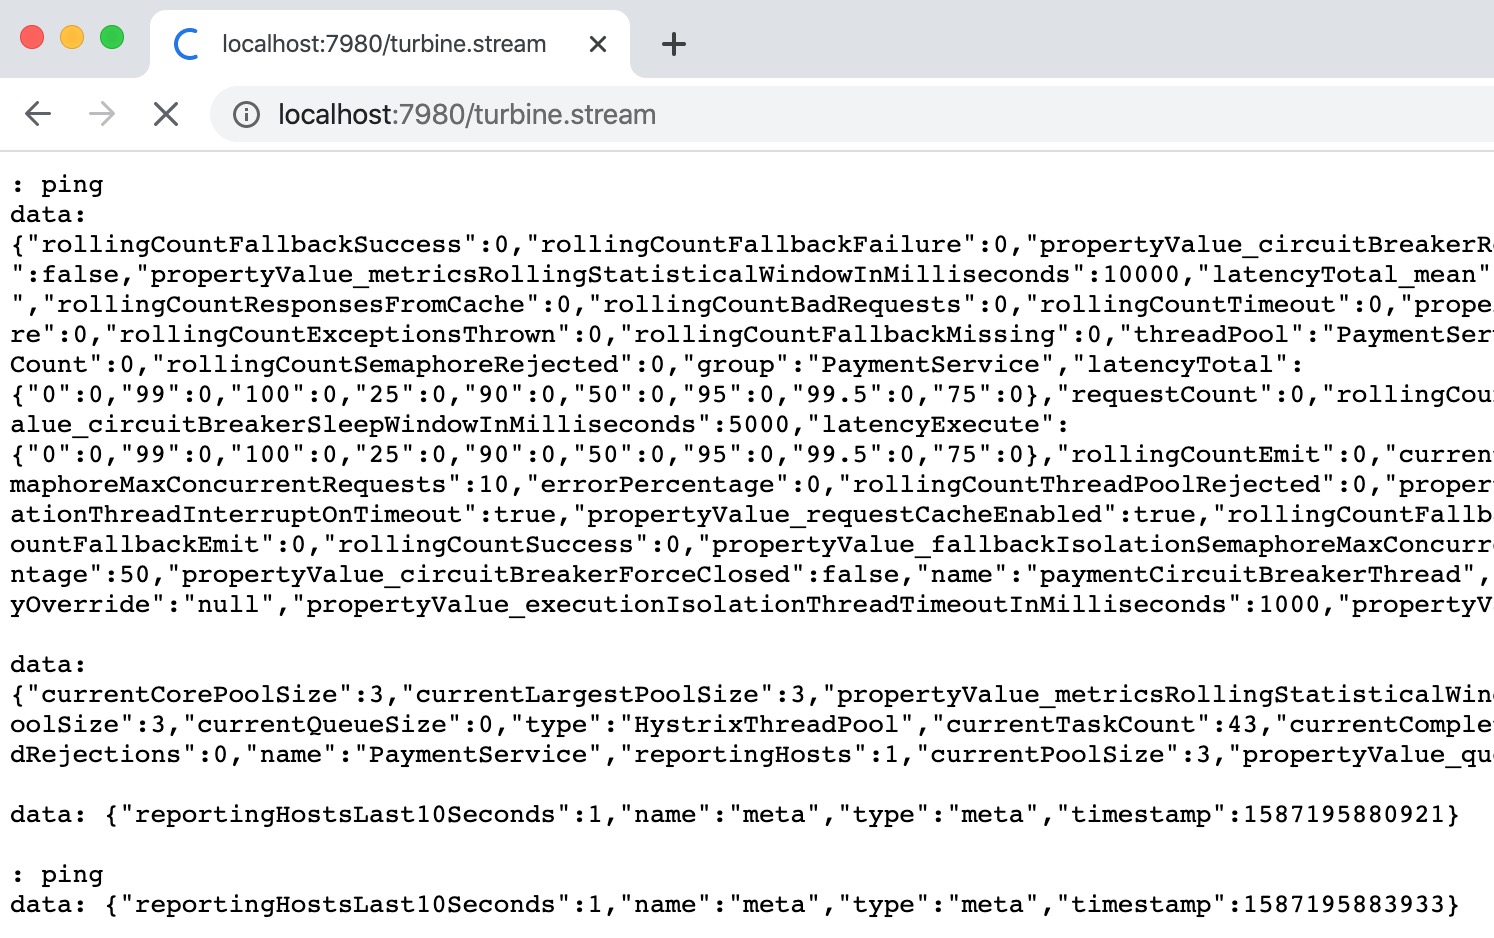
3)访问地址:http://localhost:7980/turbine.stream,查看Turbine服务是否正常
4)打开Hystrix仪表板监控地址:http://localhost:7979/hystrix
5)在Hystrix仪表板监控输入Turbine服务地址:http://localhost:7980/turbine.stream
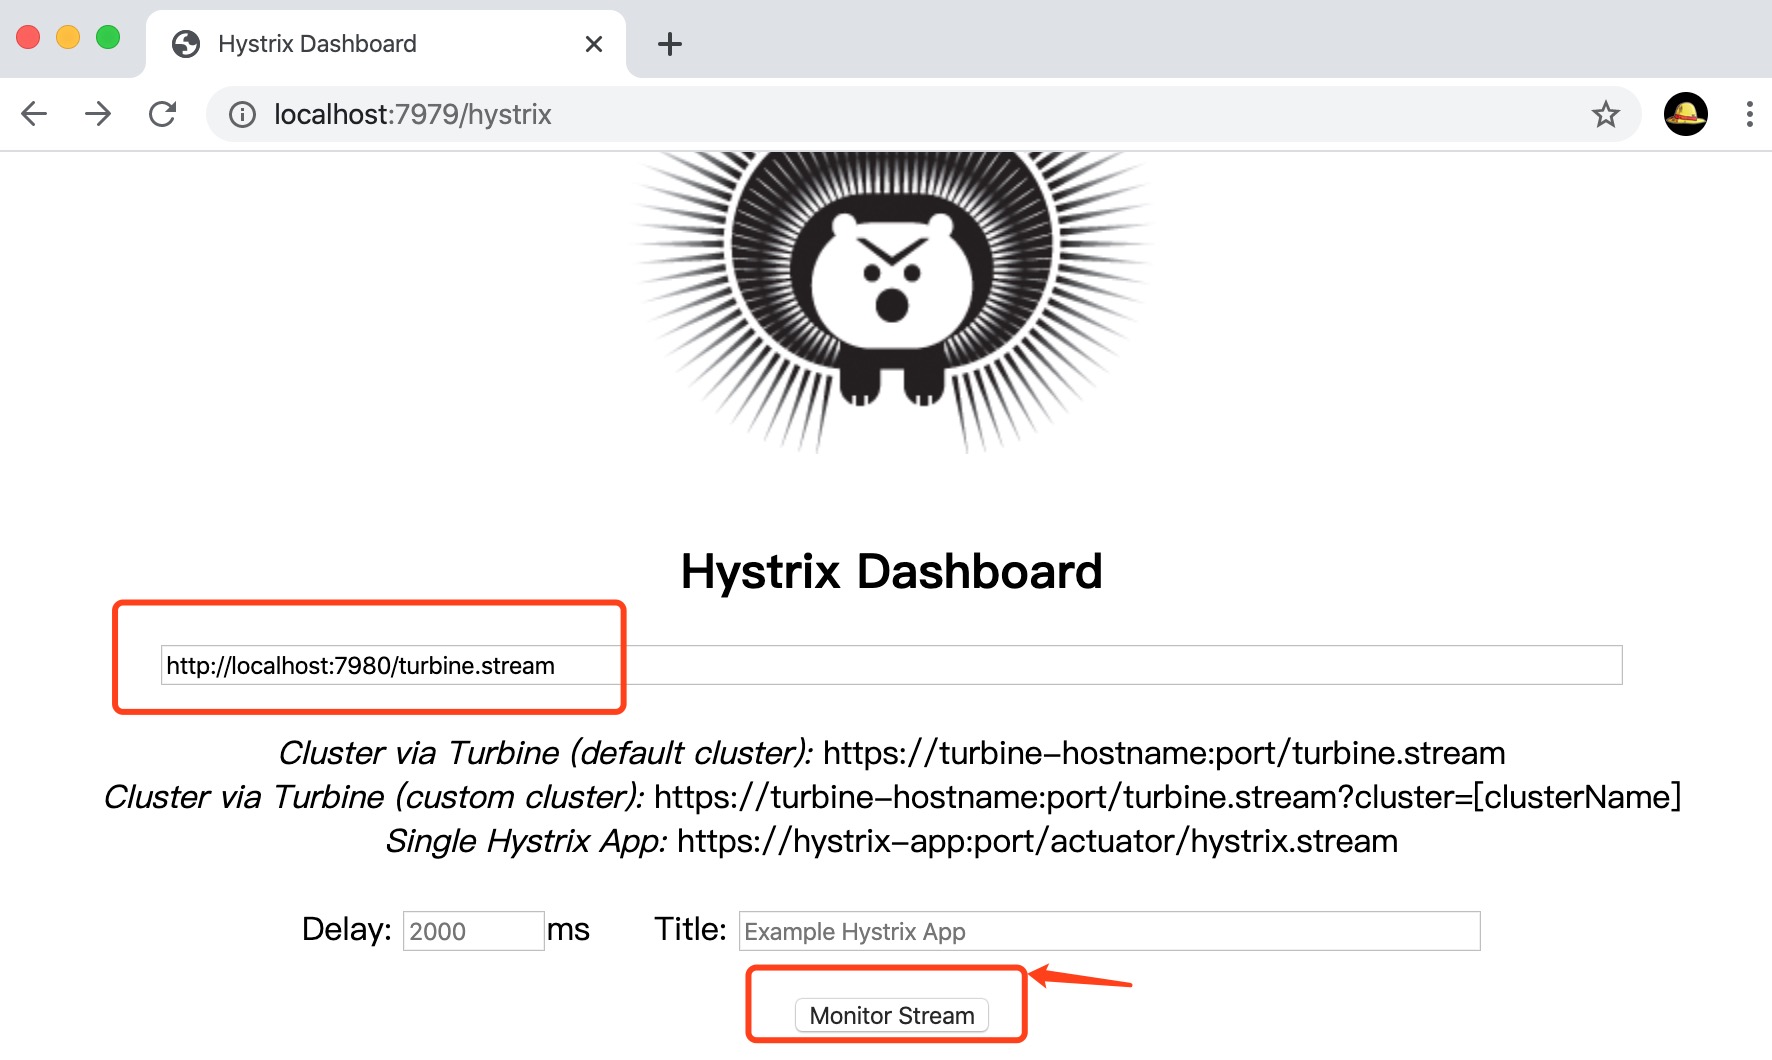
6)点击监控流,并使用http请求hystrix服务中的接口,效果如下
本文来自博客园,作者:荣慕平,转载请注明原文链接:https://www.cnblogs.com/rongmuping/articles/16307096.html

 浙公网安备 33010602011771号