

samply 基于命令行的profile 工具
samply 是基于rust 开发的一个跨平台的profile 工具,使用上比较简单,同时机遇firefox profiler 进行可视化展示
支持的命令行
samply is a sampling CPU profiler.
Run a command, record a CPU profile of its execution, and open the profiler UI.
Recording is currently supported on Linux and macOS.
On other platforms, samply can only load existing profiles.

EXAMPLES:
    # Default usage:
    samply record ./yourcommand yourargs

    # On Linux, you can also profile existing processes by pid:
    samply record -p 12345 # Linux only

    # Alternative usage: Save profile to file for later viewing, and then load it.
    samply record --save-only -o prof.json -- ./yourcommand yourargs
    samply load prof.json # Opens in the browser and supplies symbols

    # Import perf.data files from Linux perf:
    samply import perf.data


Usage: samply <COMMAND>

Commands:
  record  Record a profile and display it
  load    Load a profile from a file and display it
  import  Import a perf.data file and display the profile
  setup   Codesign the samply binary on macOS to allow attaching to processes
  help    Print this message or the help of the given subcommand(s)

Options:
  -h, --help     Print help
  -V, --version  Print version
一个参考效果
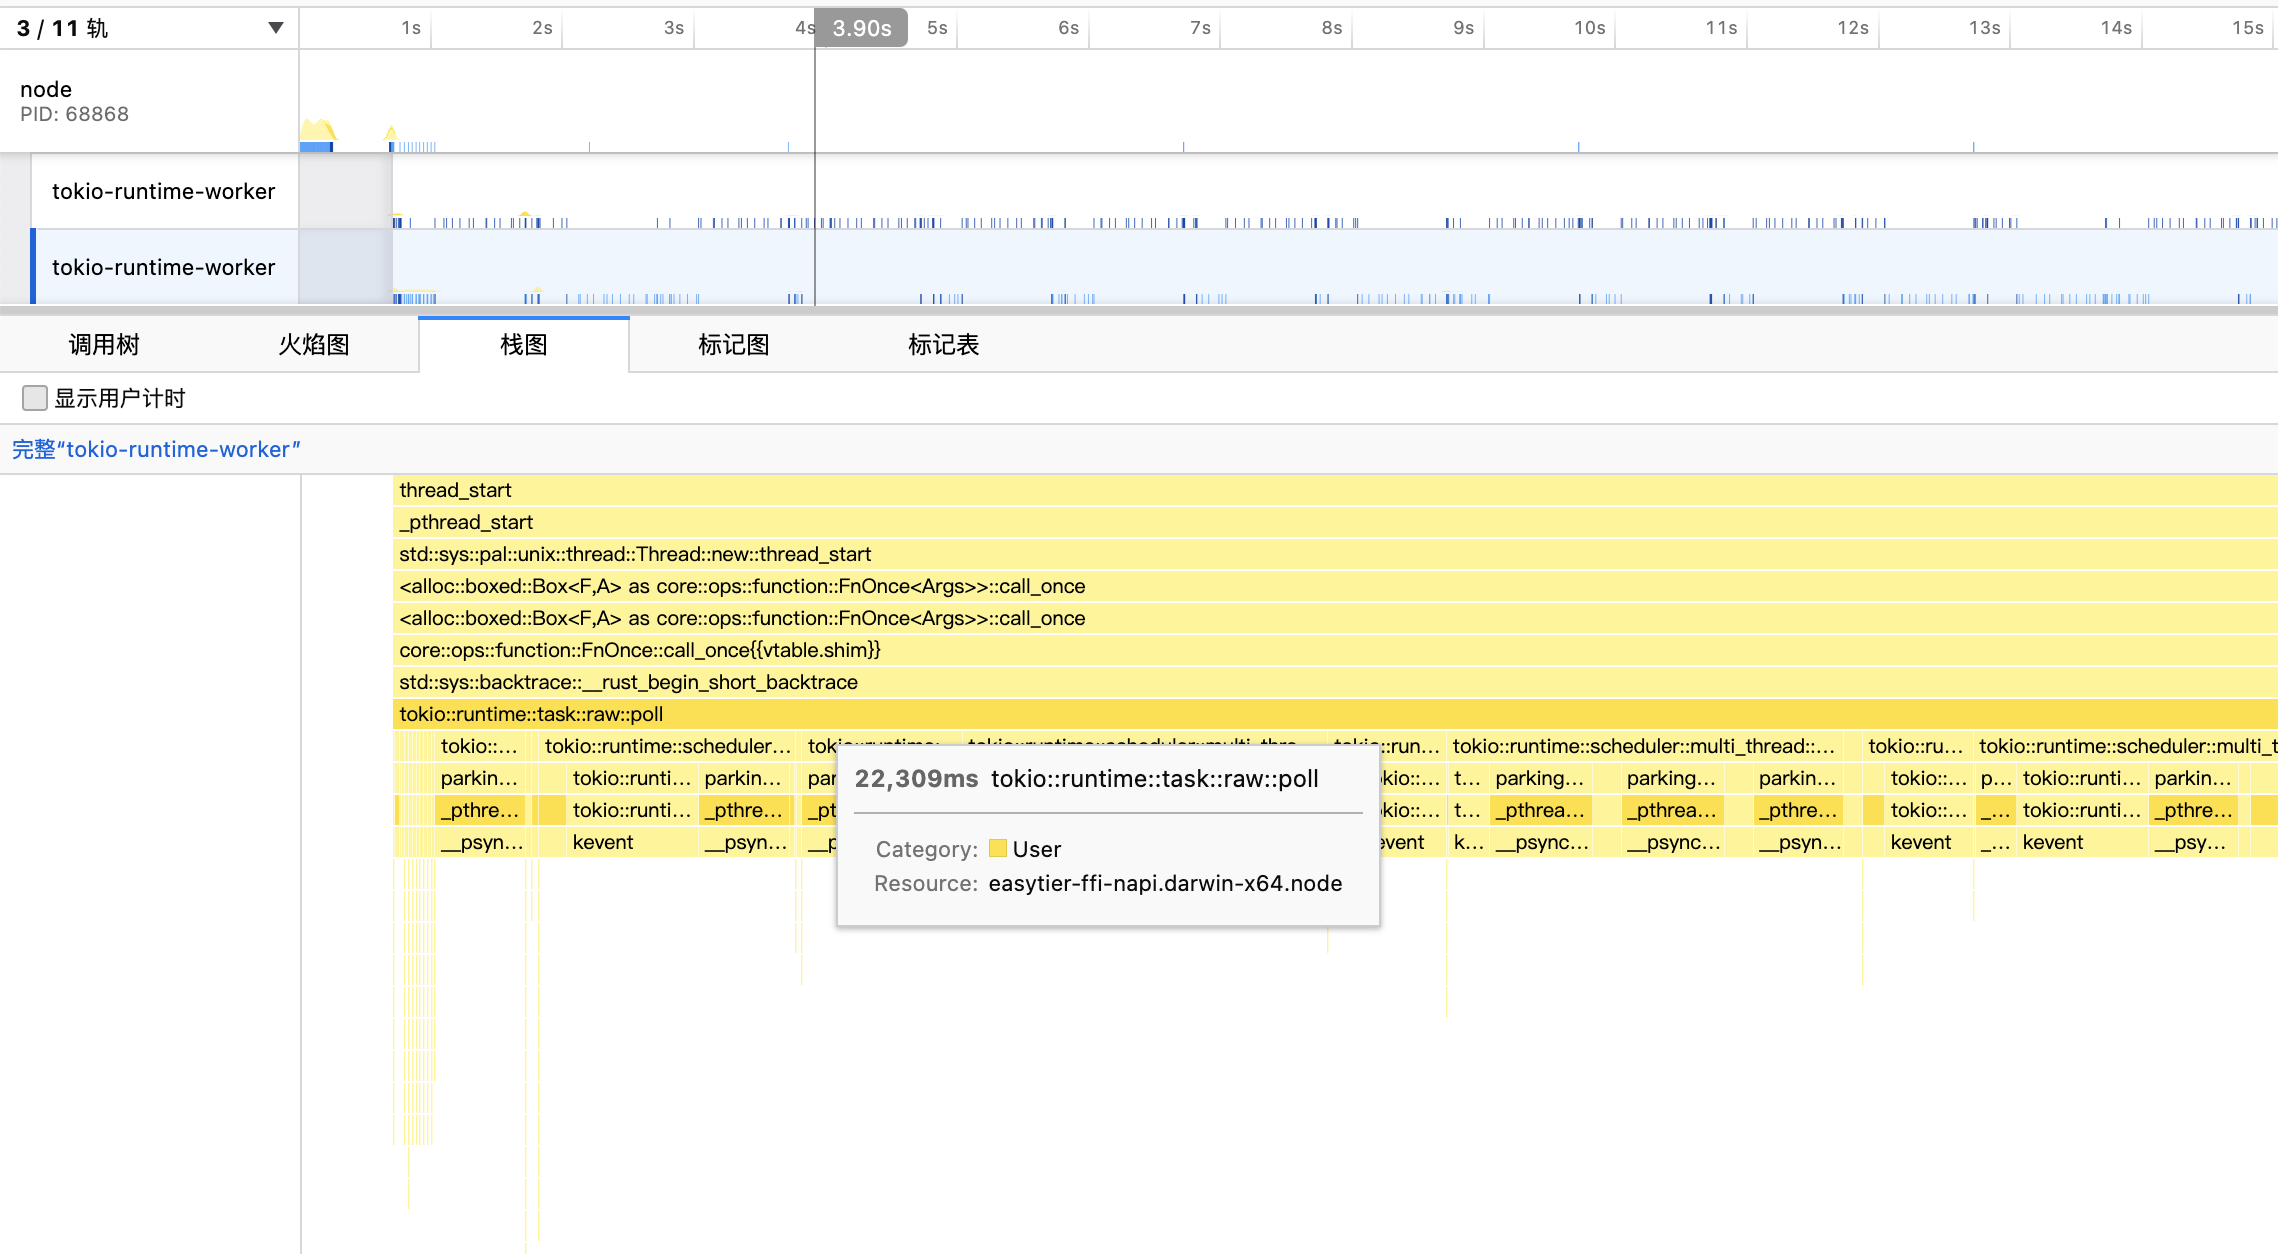
一个rust node addon 的效果
说明
samply 使用简单,同时还支持perf 的prpfiler,很值得尝试下


 浙公网安备 33010602011771号