prometheus监控linux系统
安装node exporter
创建Systemd服务

#vim /etc/systemd/system/node_exporter.service
[Unit]
Description=mysql_exporter
After=network.target
[Service]
Type=simple
User=prometheus
ExecStart=/usr/local/prom/exporter/node_exporter_0170/node_exporter
Restart=on-failure
[Install]
WantedBy=multi-user.target
启动node_exporter
# systemctl start node_exporter
# systemctl status node_exporter
验证
curl http://localhost:9100/metrics
添加prometheus相关配置
# vi prometheus280/prometheus.yml
##linux##
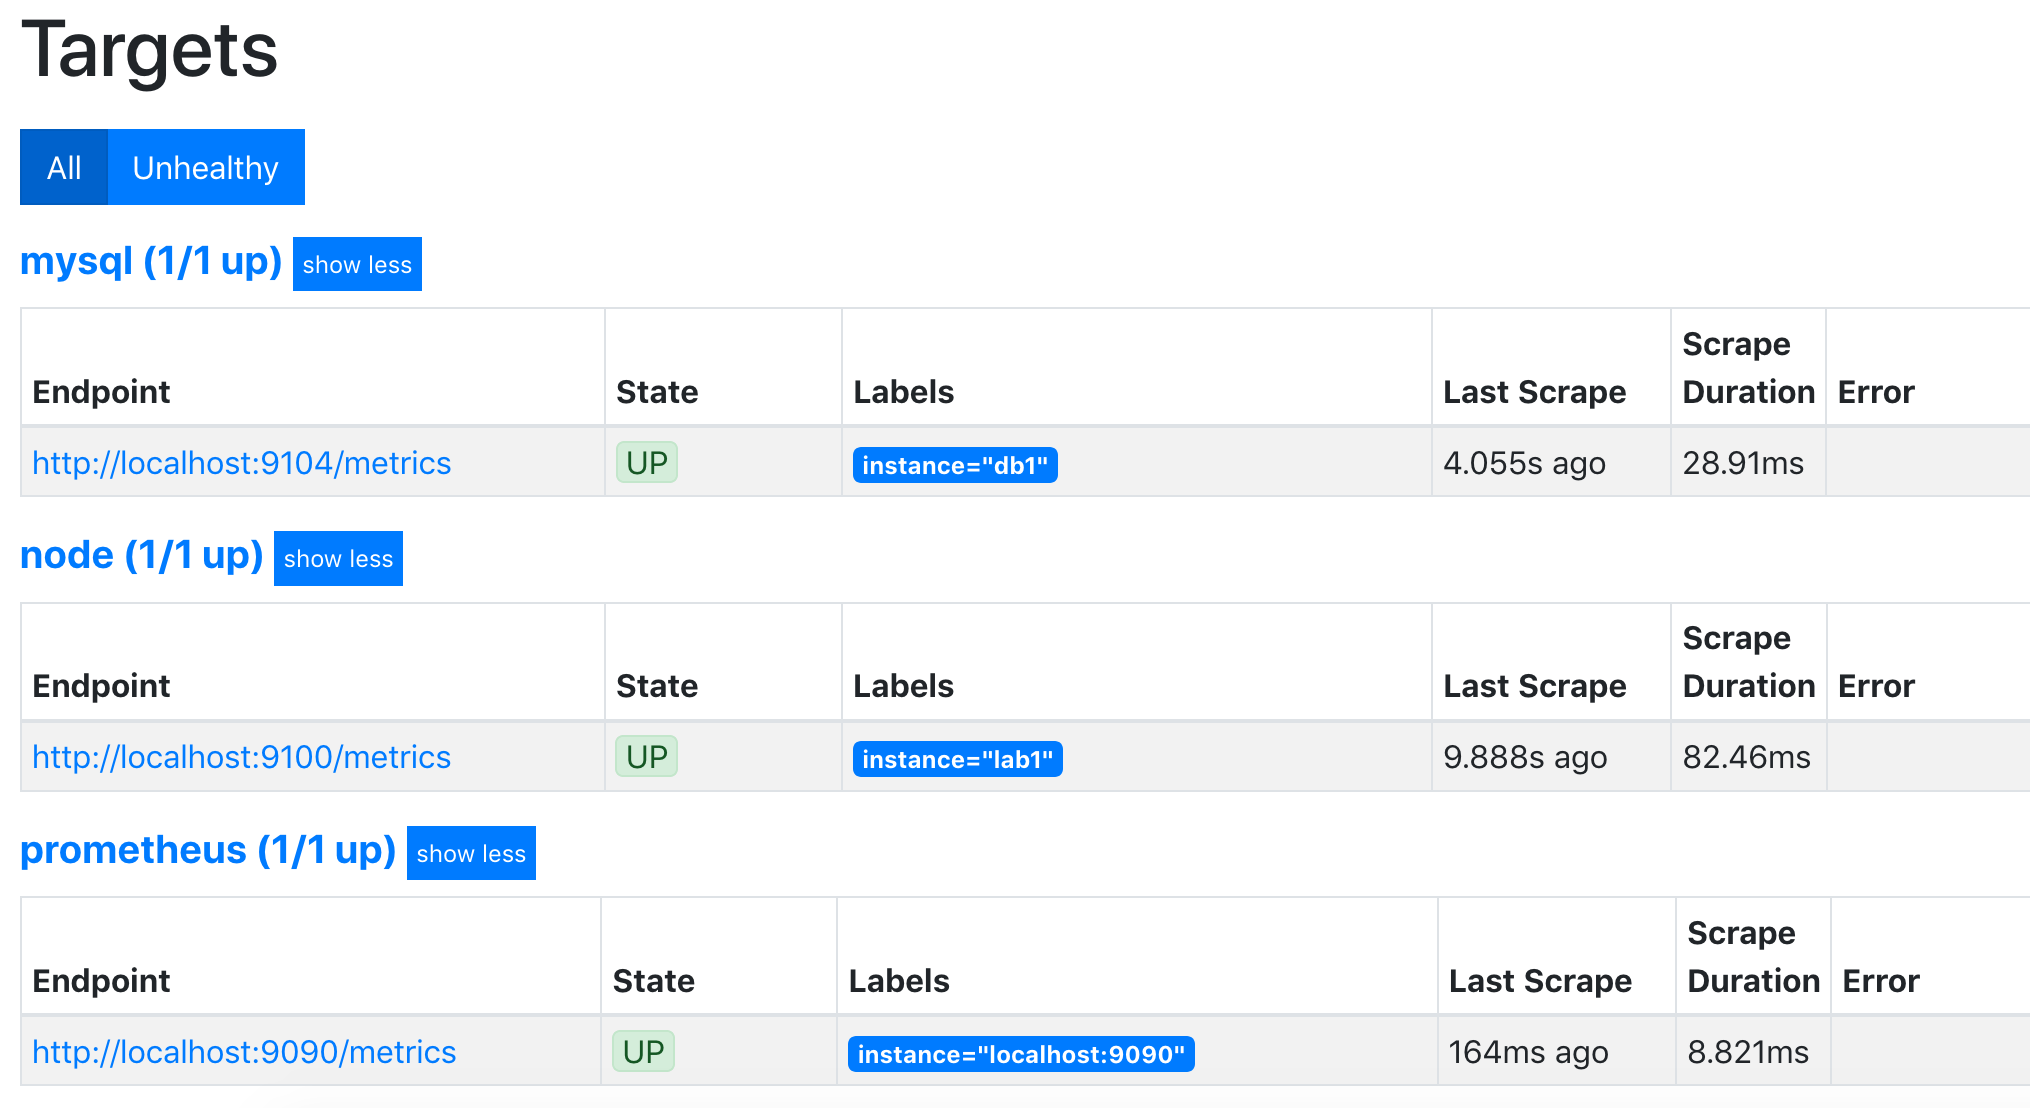
- job_name: 'node'
static_configs:
- targets: ['localhost:9100']
labels:
instance: lab1
重启prometheus即可
grafana dashboard
https://grafana.com/dashboards/8919
注意事项:
需要安装饼图的插件:
grafana-cli plugins install grafana-piechart-panel
# 请确保安装后能正常添加饼图。

需要重启grafanaservice grafana-server restart
https://github.com/starsliao/Prometheus


 浙公网安备 33010602011771号