echarts 柱状图,每根柱子显示不同颜色(随机显示和定制显示)
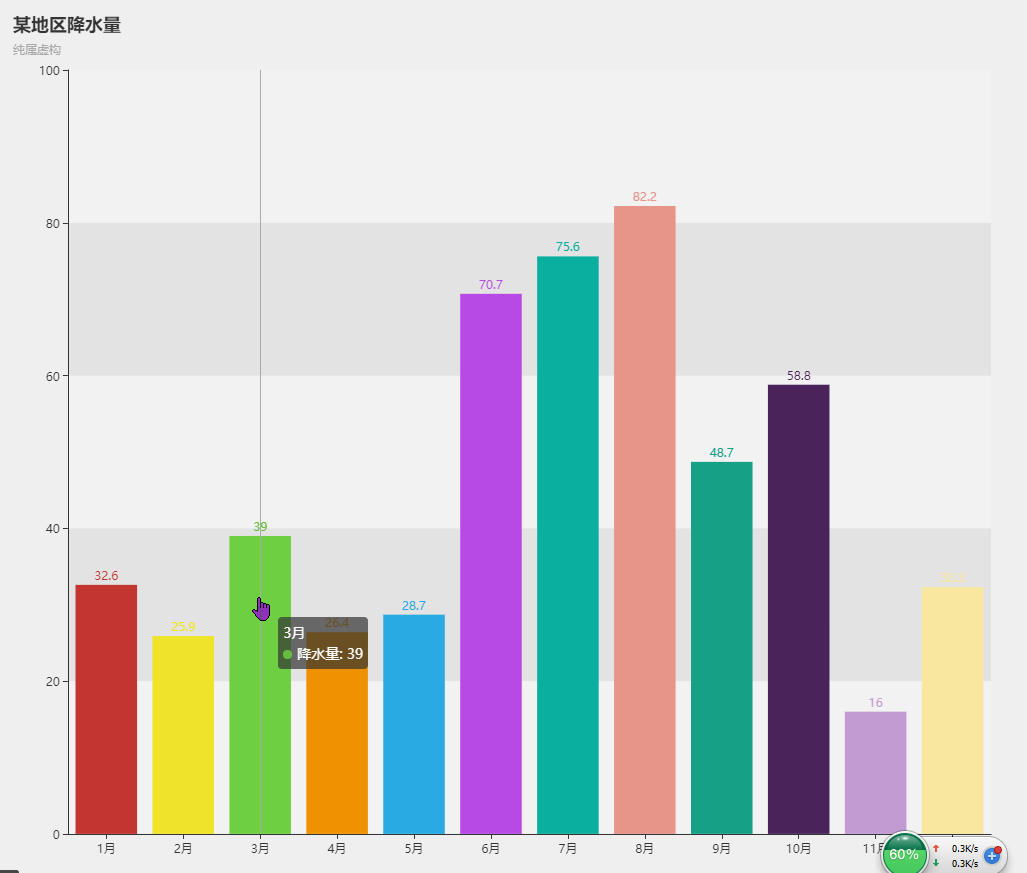
1,定制显示
option = {

    title: {
        text: '某地区降水量',
        subtext: '纯属虚构'
    },
    tooltip: {
        trigger: 'axis'
    },
    grid: {
        left: '3%',
        right: '4%',
        bottom: '3%',
        containLabel: true
    },
    xAxis: [{
        type: 'category',
        data: ['1月', '2月', '3月', '4月', '5月', '6月', '7月', '8月', '9月', '10月', '11月', '12月'],
        splitLine: {
            show: false
        },
        axisTick: {
            alignWithLabel: true
        }
    }],
    yAxis: [{
        type: 'value',
        splitLine: {
            show: false
        },
        splitArea: {
            show: true,
        },
    }],
    series: [{
        name: '降水量',
        type: 'bar',
        label: {
            normal: {
                show: true,
                position: 'top'
            }
        },
        itemStyle: {
            normal: {
                // 随机显示
                //color:function(d){return "#"+Math.floor(Math.random()*(256*256*256-1)).toString(16);}

                // 定制显示(按顺序)
                color: function(params) {
                    var colorList = ['#C33531','#EFE42A','#64BD3D','#EE9201','#29AAE3', '#B74AE5','#0AAF9F','#E89589','#16A085','#4A235A','#C39BD3 ','#F9E79F','#BA4A00','#ECF0F1','#616A6B','#EAF2F8','#4A235A','#3498DB' ];
                    return colorList[params.dataIndex]
                }
            },
        },
        data: [32.6, 25.9, 39.0, 26.4, 28.7, 70.7, 75.6, 82.2, 48.7, 58.8, 16.0, 32.3],
    }]
};
效果图:
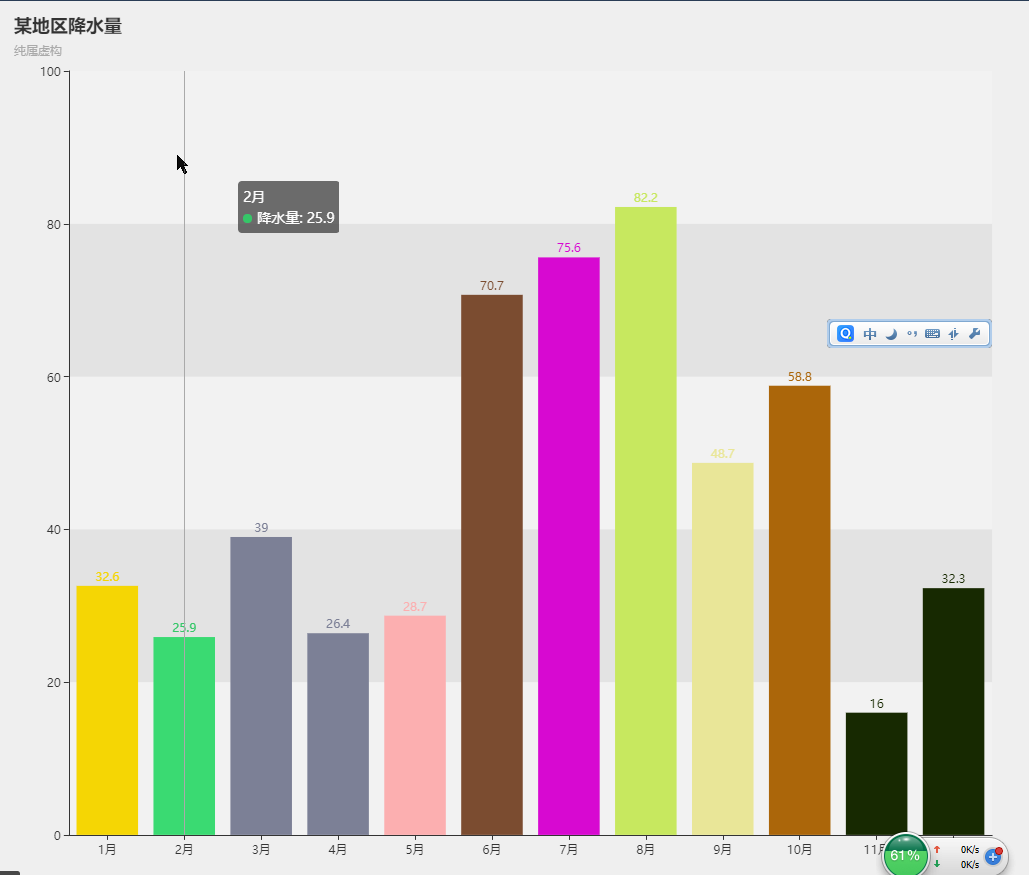
2,随机显示(每次刷新結果不一樣)
更多内容,可访问:http://rexyan.cn

 浙公网安备 33010602011771号