

Dundas Chart Demo For New User
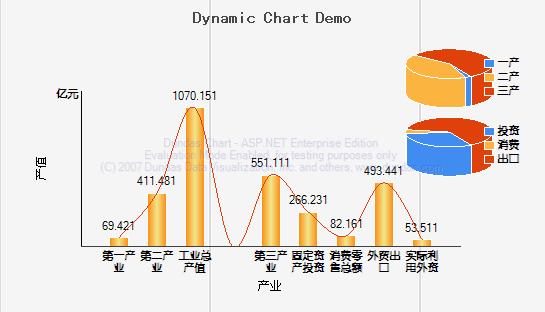
最近项目要用到Dundas Chart组件了,做个小东西熟悉一下,做了一天了,图的效果不错。
this is html code
1

 <%
<% @ Page Language="C#" AutoEventWireup="true" Codebehind="HandsDrawingChart.aspx.cs"
2
 Inherits="DundasChartDemo.HandsDrawingChart" %>
3

4
<!DOCTYPE html PUBLIC "-//W3C//DTD XHTML 1.0 Transitional//EN" "http://www.w3.org/TR/xhtml1/DTD/xhtml1-transitional.dtd">5
<html xmlns="http://www.w3.org/1999/xhtml">6
<head runat="server">7
<title>Dundas Chart Demo</title>8
</head>9
<body>10
<form id="form1" runat="server">11
<div>12
<table width="80%" border="1">13
<!--Title-->14
<tr>15
<td colspan="2" align="center">16
<p>17
<font color="blue">this is a dynamic chart</font></p>18
</td>19
</tr>20
<tr>21
<td>22
<asp:Button ID="btnSearch" runat="server" Text="显示图表" OnClick="btnSearch_Click" />23
</td>24
<td>25
</td>26
</tr>27
<tr>28
<td><asp:Image ID="Image1" runat="server" Visible="false"/>29
</td>30
<td>31
</td>32
</tr>33
<tr>34
<td><p>dundas chart demo</p>35
</td>36
<td><p>it is very cool</p>37
</td>38
</tr>39
</table> 40
</div>41
</form>42
</body>43
</html>44
Code Bihind
1
using Dundas.Charting.WebControl;2
using System.Drawing;3
4
namespace DundasChartDemo5
{6
 public partial class HandsDrawingChart : System.Web.UI.Page
7

 {
{8
protected void Page_Load(object sender, EventArgs e)9
{10
11
 }
}12
13
protected void btnSearch_Click(object sender, EventArgs e)14
{15
this.CreateChart();16
this.Image1.Visible = true;17
this.Image1.ImageUrl = "~/chart.jpg";18
}19
20
/**//// <summary>21
/// create chart dynmic22
/// </summary>23
protected void CreateChart()24
{25
//needed to bind data26
double industry1 = 19.32;27
double industry2 = 361.38;28
double industry3 = 501.01;29
double industryfull = 1020.05;30
double fixedasserts = 216.13;//fixed 固定的 assert断言,声称31
double retailtrade = 32.06;//retail 零售32
double foreigntrade = 443.34;33
double foreigncapital = 3.41;34
35
36
//crate a chart for industry37
Chart Chart1 = new Chart();//define a chart object38
Chart1.BackImage = this.Server.MapPath("~/images/backimage.gif");//背景图片39
Chart1.BackGradientEndColor = Color.White;//gradient 倾斜度40
Chart1.BorderLineColor = Color.Transparent;//border的颜色,border是什么?最外层边框厚度41
Chart1.BorderLineWidth = 0;42
Chart1.BorderSkin.FrameBackColor = Color.MediumTurquoise;//borderskin是什么?43
Chart1.BorderSkin.FrameBackGradientEndColor = Color.Teal;//teal是什么颜色?44
Chart1.Palette = ChartColorPalette.Dundas;//palette 默板?颜色默板45
Chart1.Width = 545;//chart's width46
Chart1.Height = 312;//chart's height47
Chart1.ImageType = ChartImageType.Jpeg;//chart's type like jpg png or svg also48
Chart1.AntiAliasing = AntiAliasing.Text;//antialiasing is what?49
Chart1.Titles.Add("ChartDemo");//add a title to titles collection50
Chart1.Titles[0].Text = "Dynamic Chart Demo";51
Chart1.Titles[0].Alignment = ContentAlignment.BottomCenter;//title 的对齐方式52
Chart1.Titles[0].Font = new Font("黑体", 12, FontStyle.Bold);//set title[0]'s font style53
Chart1.Titles[0].Color = Color.FromArgb(72, 72, 72);54
55
pie chart 一产 二产 三产#region pie chart 一产 二产 三产56
//define chart style57
Chart1.ChartAreas.Add("Default");//添加一个chartarea,图表区58
ChartArea chartarea1 = Chart1.ChartAreas["Default"];59
chartarea1.Area3DStyle.Enable3D = true;//设置3d样式60
chartarea1.Area3DStyle.Light = LightStyle.None;//光线样式吗?61
chartarea1.Area3DStyle.XAngle = 70;//what62
chartarea1.Area3DStyle.YAngle = 60;//what63
chartarea1.BorderWidth = 0;64
chartarea1.BackColor = Color.Transparent;65
chartarea1.Position.Auto = false;//position is what?66
chartarea1.Position.Width = 50;67
chartarea1.Position.Height = 30;68
chartarea1.Position.X = 65;69
chartarea1.Position.Y = 10;70
71
/**////设置图例区域样式72
Legend legend1=Chart1.Legends["Default"];73
legend1.Alignment=StringAlignment.Center;74
legend1.BorderWidth = 1;75
legend1.Font = new Font("幼圆",8,FontStyle.Bold);//字体76
legend1.BackColor = Color.Transparent;77
legend1.FontColor = Color.Black;78
legend1.DockInsideChartArea = true;//what is this79
legend1.DockToChartArea = "Default";//chartarea 's name?80
81
/**////邦定数据("一产","二产","三产")82
double[] yValue ={ industry1, industry2, industry3 };83
string[] xValue ={ "一产", "二产", "三产" };84
Chart1.Series.Add("Default");85
Series series1=Chart1.Series["Default"];//get default series86
series1.Points.DataBindXY(xValue,yValue);//bind a array87
series1.Type = SeriesChartType.Pie;//制定series的type88
series1.BorderColor = Color.White;89
series1.Palette = ChartColorPalette.Dundas;90
series1["LabelStyle"] = "Disabled";91
series1.ChartArea = "Default";92
series1.Legend = "Default";93
#endregion94
95
pie chart 投资 消费 出口#region pie chart 投资 消费 出口96
97
/**////set style98
Chart1.ChartAreas.Add("Second");99
ChartArea chartarea2=Chart1.ChartAreas["Second"];100
chartarea2.Area3DStyle.Enable3D = true;//set 3d style101
chartarea2.Area3DStyle.Light = LightStyle.None;//?102
chartarea2.Area3DStyle.XAngle=70;103
chartarea2.Area3DStyle.YAngle=60;104
chartarea2.BorderWidth = 0;105
chartarea2.BackColor = Color.Transparent;106
chartarea2.Position.Auto = false;//?107
chartarea2.Position.Width = 50;108
chartarea2.Position.Height = 30;109
chartarea2.Position.X = 65;//?110
chartarea2.Position.Y = 32;//?111
112
/**////图例区域样式113
Legend legend2 = new Legend("Second");114
Chart1.Legends.Add(legend2);115
legend2.Alignment = StringAlignment.Center;116
legend2.BorderWidth = 0;117
legend2.BackColor = Color.Transparent;118
legend2.Font = new Font("幼圆", 8, FontStyle.Bold);119
legend2.FontColor = Color.Black;120
legend2.DockInsideChartArea = true;//this is false121
legend2.DockToChartArea = "Second";122
123
double[] yValue2 ={ fixedasserts,retailtrade,foreigntrade};124
string[] xValue2 ={"投资", "消费", "出口"};125
Chart1.Series.Add("Series2");126
Series series2=Chart1.Series["Series2"];127
series2.Points.DataBindXY(xValue2,yValue2);128
series2.Type = SeriesChartType.Pie;129
series2.BorderColor = Color.White;130
series2.Palette = ChartColorPalette.Dundas;131
series2["LabelStyle"] = "Disabled";132
series2.ChartArea = "Second";133
series2.Legend = "Second";134
#endregion135
136
柱状图#region 柱状图137
138
double[] yValues ={ industry1, industry2,industryfull,0, industry3,fixedasserts,retailtrade,foreigntrade,foreigncapital };139
double x = MaxValue(yValue) / 10;140
141
Chart1.ChartAreas.Add("Third");142
ChartArea chartarea3=Chart1.ChartAreas["Third"];143
chartarea3.Area3DStyle.Enable3D = false; //是否3d效果144
chartarea3.Area3DStyle.Light = LightStyle.Realistic;//这个效果没看出来145
146
//设置x轴的style147
chartarea3.AxisX.LineColor = Color.FromArgb(64,64,64);148
chartarea3.AxisX.LabelStyle.Font = new Font("幼圆",8,FontStyle.Bold);149
chartarea3.AxisX.LabelStyle.FontColor = Color.Black;150
chartarea3.AxisX.LabelStyle.OffsetLabels = false;//what is this? 可以理解为是否允许xname换行,单排显示,还是起伏错开显示 offset:偏移量151
chartarea3.AxisX.LabelsAutoFit = false;//? 感觉效果同上 是否允许出现偏移152
chartarea3.AxisX.MajorGrid.Enabled = false;//what is this ? 线 纬度线 是否显示水平方向的线条153
chartarea3.AxisX.MajorTickMark.Enabled = true;//2 up? 是否在x轴做标记,154
chartarea3.AxisX.MajorTickMark.LineColor = Color.Transparent;155
chartarea3.AxisX.MajorTickMark.Interval = 4;//what is this? 每个4个标记一下x轴156
chartarea3.AxisX.Title = "产业";157
158
//设置y轴style159
chartarea3.AxisY.CustomLabels.Add(0,MaxValue(yValues)*2.3,"亿元");//?160
chartarea3.AxisY.LabelStyle.Enabled = true;//what is this? Y轴的lable161
chartarea3.AxisY.LabelStyle.FontAngle = 0; //2 up?162
chartarea3.AxisY.LabelStyle.Font = new Font("幼圆",8,FontStyle.Bold);163
chartarea3.AxisY.MajorGrid.Enabled = false;//? 线 经度线 是否显示垂直方向的线条164
chartarea3.AxisY.MajorTickMark.Enabled = false;//? 是否显示y周标记165
chartarea3.AxisY.Title = "产值"; 166
167
//chartarea 的style168
chartarea3.BorderWidth = 0;169
chartarea3.BackColor = Color.Transparent;170
chartarea3.Position.Auto = false;//what is this171
chartarea3.Position.Width = 80;//persent172
chartarea3.Position.Height = 67;173
chartarea3.Position.X = 5;//? 图片位于chart内的起始x坐标,最右边100 和我们长用的坐标反向,老外就是不一样,174
chartarea3.Position.Y = 28;//? 图片位于chart内的起始y坐标,最下边100175
176
Legend legend3 = new Legend("Third");177
Chart1.Legends.Add(legend3);178
legend3.Enabled = false;179
legend3.DockToChartArea = "Third";180
181
//数据源182
double[] yValue3 ={ industry1 + x, industry2 + x, industryfull + x, 0, industry3 + x, fixedasserts + x, retailtrade + x, foreigntrade + x, foreigncapital + x };183
string[] xValue3 ={"第一产业", "第二产业", "工业总产值", " ", "第三产业", "固定资产投资", "消费零售总额", "外贸出口", "实际利用外资" };184
185
Chart1.Series.Add("Series3");186
Series series3=Chart1.Series["Series3"];187
series3.Points.DataBindXY(xValue3,yValue3);//databind188
series3.Type = SeriesChartType.Column;//柱状图189
series3.BorderColor = Color.White;190
series3.BackGradientType = GradientType.VerticalCenter;//?191
series3.BackGradientEndColor = Color.Khaki;//?192
series3.Color = Color.FromArgb(255,128,0);193
series3["PointWidth"]="0.5";//柱子的宽度194
series3.ChartArea = "Third";195
series3.Legend = "Third";196
197
Chart1.Series.Add("Series4");198
Series series4=Chart1.Series["Series4"];199
series4.Type = SeriesChartType.Spline;200
//series4.Points.DataBindXY(xValue3,yValue3);201
series4.ChartArea = "Third";202
series4.Legend = "Third";203
204
Chart1.Series["Series4"].Points.DataBindY(yValue3);205
206
//显示每列的值207
int count = series3.Points.Count;208
for (int i = 0; i < count; i++)209
{210
if (yValue3[i] != 0)211
{212
series3.Points[i].Label = yValue3[i].ToString();213
}214
}215
216
#endregion217
218
//save to memory219
Chart1.Save(this.Server.MapPath("~/chart.jpg"), ChartImageFormat.Jpeg);//server.mappath 映射成服务器绝对路径220
}221
222
/**//// <summary>223
/// get a double array's maxvalue224
/// </summary>225
/// <param name="array"></param>226
public double MaxValue(double[] array)227
{228
double maxValue = 0;229
int length = array.Length;230
231
for (int i = 0; i < length; i++)232
{233
if (array[i] > maxValue)234
{ 235
maxValue=array[i];236
}237
}238
239
return maxValue;240
}241
}242
}这里暂时只演示的静态数据,动态邦定的例子我写完了再发。
总结一下:
/*chart的过程
* 1,new one chart() object
* 2,set chart style
* 3,add chartarea into chart
* 4,new one legend() object
* 5,set legend() style just alin and font
* 6,add legend() to chart's lengends collection
* 7,dock legend() to a chartarea
* 8,add series to chart 's series collection chart1.series.add("name");
* 9,new series() object series ss=chart1.series["name"];
* 10,series databind
* 11,series.chartarea="chartarea name"
* 12,series.legend="legend name"
* 13,series is real chart to show for us eye?!
* 14,save dynamic picture to server and set image control's imageurl is picture's url
*/
偶 Englis very pool.sorry :^)

 浙公网安备 33010602011771号