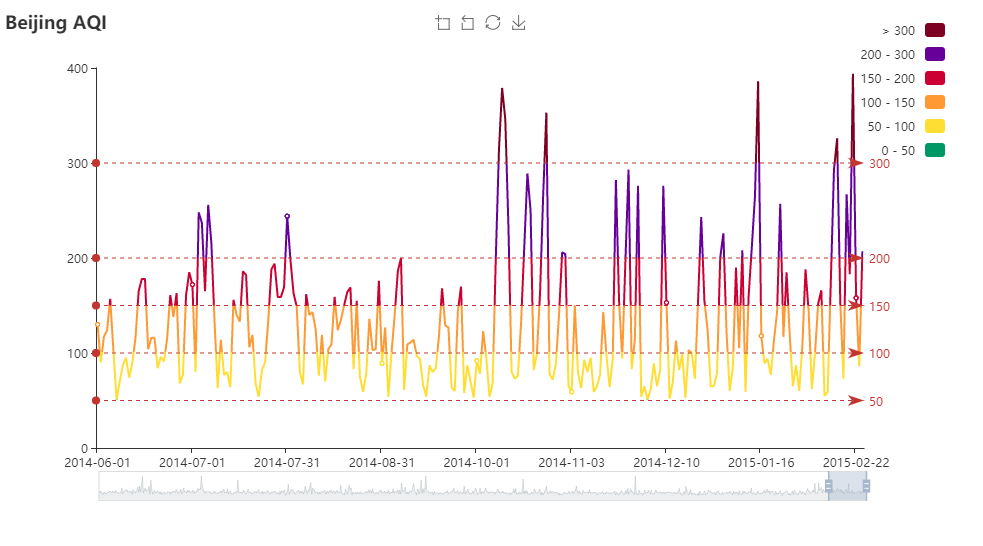
echarts分段(一段一种颜色)显示
<!DOCTYPE html>
<html>
    <head>
        <meta charset="UTF-8">
        <title></title>
        <script src="echarts.js"></script>
        <script src="jquery-1.10.2.js"></script>
    </head>
    <body>
        <div id="box" style="width:960px;height:500px;margin:0 auto;"></div>
        <script>
            var myChart = echarts.init(document.getElementById('box'));
            $.get('aqi-beijing.json', function (data) {
                myChart.setOption(option = {
                    title: {
                        text: 'Beijing AQI'
                    },
                    tooltip: {
                        trigger: 'axis'
                    },
                    xAxis: {
                        data: data.map(function (item) {
                            return item[0];
                        })
                    },
                    yAxis: {
                        splitLine: {
                            show: false
                        }
                    },
                    toolbox: {
                        left: 'center',
                        feature: {
                            dataZoom: {
                                yAxisIndex: 'none'
                            },
                            restore: {},
                            saveAsImage: {}
                        }
                    },
                    dataZoom: [{
                        startValue: '2014-06-01'
                    }, {
                        type: 'inside'
                    }],
                    visualMap: {
                        top: 10,
                        right: 10,
                        pieces: [{
                            gt: 0,
                            lte: 50,
                            color: '#096'
                        }, {
                            gt: 50,
                            lte: 100,
                            color: '#ffde33'
                        }, {
                            gt: 100,
                            lte: 150,
                            color: '#ff9933'
                        }, {
                            gt: 150,
                            lte: 200,
                            color: '#cc0033'
                        }, {
                            gt: 200,
                            lte: 300,
                            color: '#660099'
                        }, {
                            gt: 300,
                            color: '#7e0023'
                        }],
                        outOfRange: {
                            color: '#999'
                        }
                    },
                    series: {
                        name: 'Beijing AQI',
                        type: 'line',
                        data: data.map(function (item) {
                            return item[1];
                        }),
                        markLine: {
                            silent: true,
                            data: [{
                                yAxis: 50
                            }, {
                                yAxis: 100
                            }, {
                                yAxis: 150
                            }, {
                                yAxis: 200
                            }, {
                                yAxis: 300
                            }]
                        }
                    }
                });
            });
        </script>
    </body>
</html>
demo链接:http://echarts.baidu.com/demo.html#line-aqi
api:http://echarts.baidu.com/option.html#visualMap-piecewise.pieces
<!DOCTYPE html>
<html>
<head>
<meta charset="UTF-8">
<title></title>
<script src="echarts.js"></script>
</head>
<body>
<div id="box" style="width:960px;height:500px;margin:0 auto;"></div>
<script>
var weiChart = echarts.init(document.getElementById('box'));
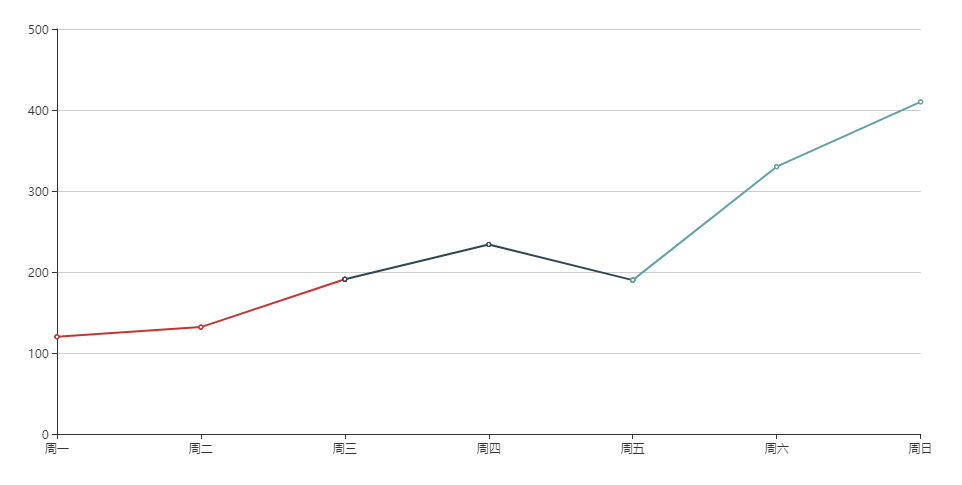
var data1=[120, 132, 191, "-", "-", "-", "-"];
var data2=["-", "-", 191, 234, 190, "-", "-"];
var data3=["-", "-", "-", "-", 190, 330, 410];
option = {
title: {
text: '折线图堆叠'
},
tooltip: {
trigger: 'axis'
},
grid: {
left: '3%',
right: '4%',
bottom: '3%',
containLabel: true
},
toolbox: {
feature: {
saveAsImage: {}
}
},
xAxis: {
type: 'category',
boundaryGap: false,
data: ['周一','周二','周三','周四','周五','周六','周日']
},
yAxis: {
type: 'value'
},
series: [
{
name:'',
type:'line',
data:data1
},
{
name:'',
type:'line',
data:data2
},
{
name:'',
type:'line',
data:data3
},
]
};
weiChart.setOption(option);
</script>
</body>
</html>

 浙公网安备 33010602011771号