


Feature Scaling: Normalization and Standardization
Most algorithms will probably benefit from standardization more than from normalization.
Some algorithms assume that our data is centered at 0. For example, if we initialize the weights of a small multi-layer perceptron with tanh activation units to 0 or small random values centered around zero, we want to update the model weights “equally.” As a rule of thumb I’d say: When in doubt, just standardize the data, it shouldn’t hurt.
Some examples of algorithms where feature scaling matters are:
- k-nearest neighbors with an Euclidean distance measure if want all features to contribute equally
- k-means (see k-nearest neighbors)
- logistic regression, SVMs, perceptrons, neural networks etc. if you are using gradient descent/ascent-based optimization, otherwise some weights will update much faster than others
- linear discriminant analysis, principal component analysis, kernel principal component analysis since you want to find directions of maximizing the variance (under the constraints that those directions/eigenvectors/principal components are orthogonal); you want to have features on the same scale since you’d emphasize variables on “larger measurement scales” more.
Some algorithms assume that our data is centered at 0. For example, if we initialize the weights of a small multi-layer perceptron with tanh activation units to 0 or small random values centered around zero, we want to update the model weights “equally.” As a rule of thumb I’d say: When in doubt, just standardize the data, it shouldn’t hurt.
https://sebastianraschka.com/Articles/2014_about_feature_scaling.html
In the overall knowledge discovery process, before data mining itself, data preprocessing plays a crucial role. One of the first steps concerns the normalization of the data. This step is very important when dealing with parameters of different units and scales. For example, some data mining techniques use the Euclidean distance. Therefore, all parameters should have the same scale for a fair comparison between them.
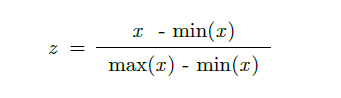
Two methods are usually well known for rescaling data. Normalization, which scales all numeric variables in the range [0,1]. One possible formula is given below:
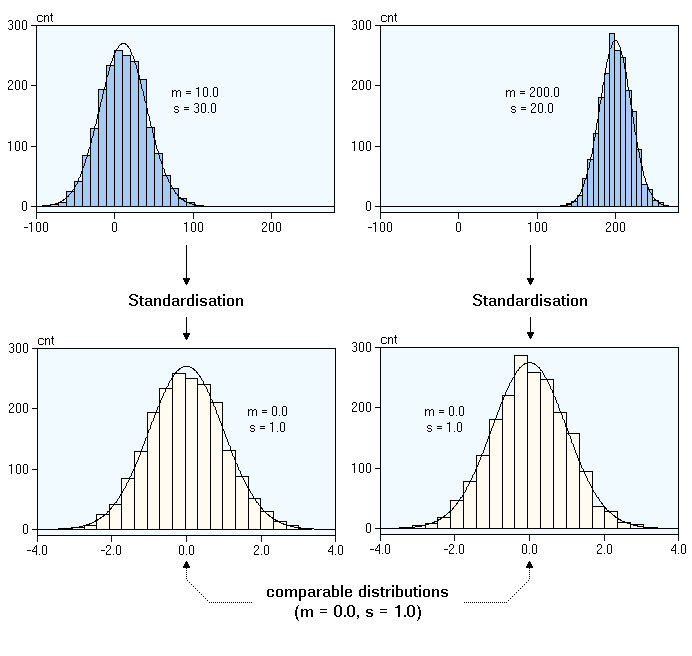
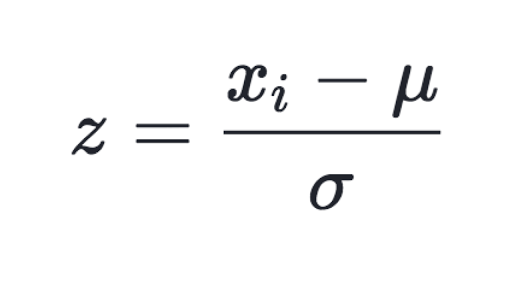
 On the other hand, you can use standardization on your data set. It will then transform it to have zero mean and unit variance, for example using the equation below:
 Both of these techniques have their drawbacks. If you have outliers in your data set, normalizing your data will certainly scale the “normal” data to a very small interval. And generally, most of data sets have outliers. When using standardization, your new data aren’t bounded (unlike normalization).
So my question is what do you usually use when mining your data and why?
Here's an example of a two variable problem:
From the last page, if you can say that standardized train traffic U1(x) versus standardized car traffic U2(y) is "additively independent", then you might be able to get away with a simple equation such as:
U(x, y) = k1*U1(x) + (1 - k1)*U2(y)
Where k1=0.5 means you're indifferent to standardized car/train traffic. A higher k1 would mean train traffic U1(x) is more important.
However, if these two variables are not "additively independent", then you'll have to use a more complicated equation. One possibility is shown on page 1:
U(x, y) = k1*U1(x) + k2*U2(y) + (1-k1-k2)*U1(x)*U2(y)
In either case, you'll have to come up with a utility U(x, y) that makes sense.
Standardize or Normalize? — Examples in Python
A common misconception is between what it is — and when to — standardize data versus normalize date.
Let’s start with normalization.
Here your data Z is rescaled such that any specific z will now be 0 ≤ z ≤ 1, and is done through this formula:
Let’s to do this with python on a dataset you can quickly access.
from sklearn import preprocessing
import numpy as np
# Get dataset
df = pd.read_csv("https://storage.googleapis.com/mledudatasets/california_housing_train.csv", sep=",")
# Normalize total_bedrooms column
x_array = np.array(df['total_bedrooms'])
normalized_X = preprocessing.normalize([x_array])
Why would we normalize in the first place?
1. Normalization makes training less sensitive to the scale of features, so we can better solve for coefficients.
Consider the dataset above of housing prices in California, which have features such as the number of bedrooms and the median household income. Each have different units and scales, so consider these feature attributes when going through this article.
Let’s start by looking at both features without normalization.
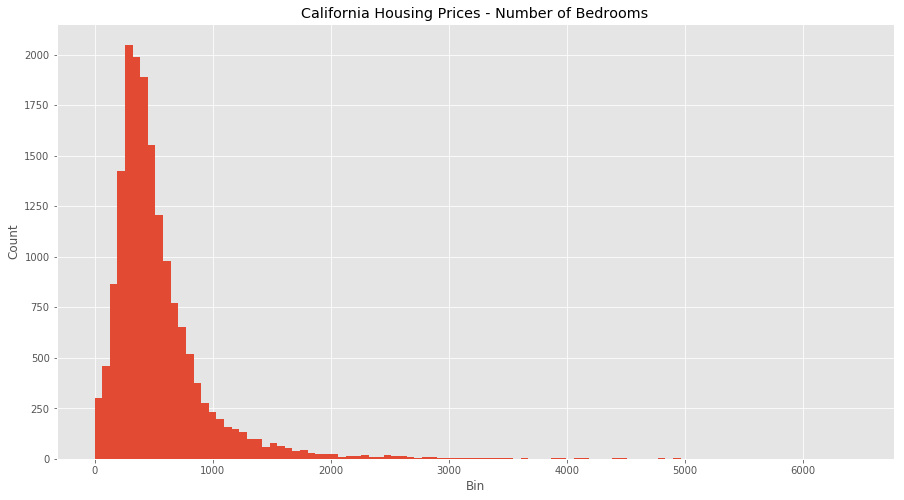
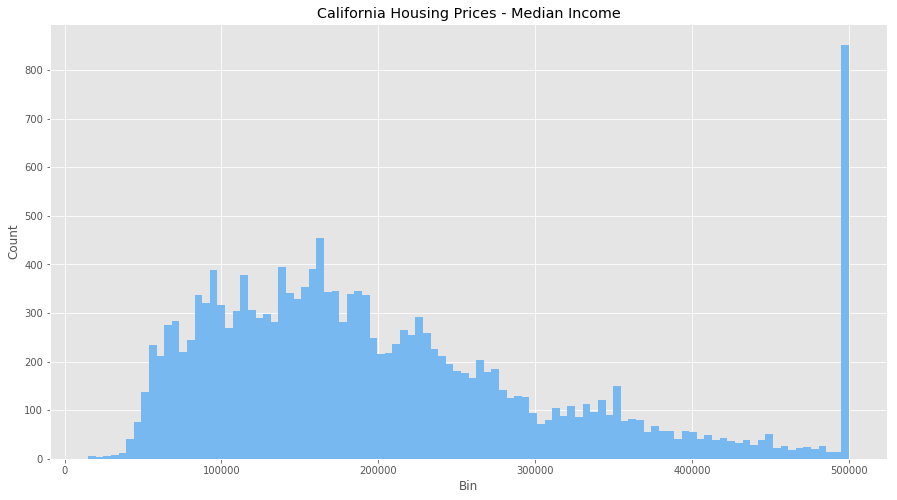
We can see that there are some odd behaviours with both features (how can we have the number of bedrooms be over 1000?) as well as massive outliers and binning issues. We also have a clustering of income at $500,000 so the dataset probably puts anyone over that bracket into that bin. It’s going to be hard to equate both these features as they are right now.
Let see what normalization does.


All the values are all now between 0 and 1, and the outliers are gone, but still remain visible within our normalized data. However, our features are now more consistent with each other, which will allow us to evaluate the output of our future models better.
2. The use of a normalization method will improve analysis from multiple models.
Additionally, if we were to use any algorithms on this data set before we normalized it would be hard (potentially not possible) to converge the vectors because of the scaling issues. Normalization makes the data better conditioned for convergence.
3. Normalizing will ensure that a convergence problem does not have a massive variance, making optimization feasible.
But wait … sometimes you might not want to normalize your data.
The data provided is proportional, so normalizing might not provide correct estimators. Or, the scale between your data features does matters so you want to keep in your dataset. You need to think about your data, and understand if the transformations you’re applying are in line with the outcomes you’re searching for.
Keep in mind, there is some debate stating it is better to have the input values centred around 0 — standardization — rather than between 0 and 1. So doing your research is important as well, so you understand what type of data is needed by your model.
So now that we know how and why to normalize, let’s move on to standardization.
Here your data Z is rescaled such that μ = 0 and 𝛔 = 1, and is done through this formula:
Why would we do this?
1. Compare features that have different units or scales.
Consider our data above with housing and income, both have different scales and units. We can start to compare these features and use them in our models once we have standardized them.
Later, when you’re running models (logistic regression, SVMs, perceptrons, neural networks etc.) the estimated weights will update similarly rather than at different rates during the build process. This will give you more accurate results when the data has been first standardized.
Let see it in python:
from sklearn import preprocessing
# Get column names first
names = df.columns
# Create the Scaler object
scaler = preprocessing.StandardScaler()
# Fit your data on the scaler object
scaled_df = scaler.fit_transform(df)
scaled_df = pd.DataFrame(scaled_df, columns=names)
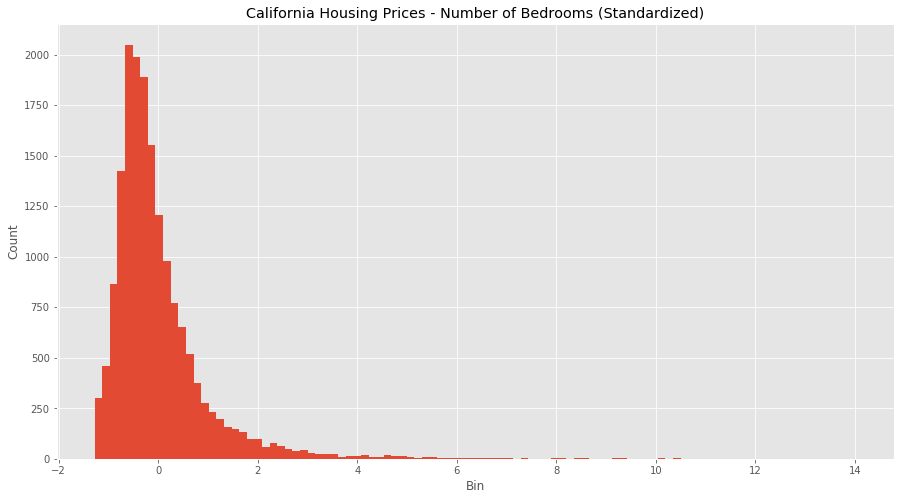
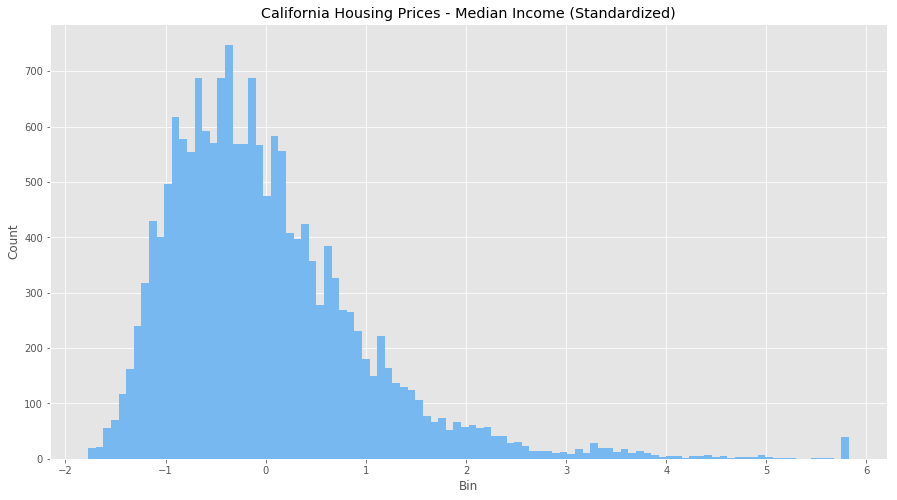
Looks like we’ve adjusted for all the outlier values in bedrooms and income, and we have a much more normal distribution for each feature. It’s not perfect, but the data is in much better shape than it was when we ran our normalization. It seems because of the large difference in scales and units, standardizing is a better transformation for this data set.
2. Standardizing tends to make the training process well behaved because the numerical condition of the optimization problems is improved.
Consider if you’re doing PCA, the output can only be interpreted correctly when the features have first been centred around their means. Again, understanding what you want to achieve and the model you’ll be using, are necessary conditions to understanding different transformations decisions.
However, if you do standardize your data be warned you might be discarding some information. If that information is not needed, the process can be helpful else it will impede your results.
Bonus Thing: Binning
Let’s take a look at one more thing before we leave … binning values.
Consider the latitude feature in our dataset, which has a geo point of the area in question. How would we think about standardizing or normalizing this? We could do either, but there is a third alternative: binning.
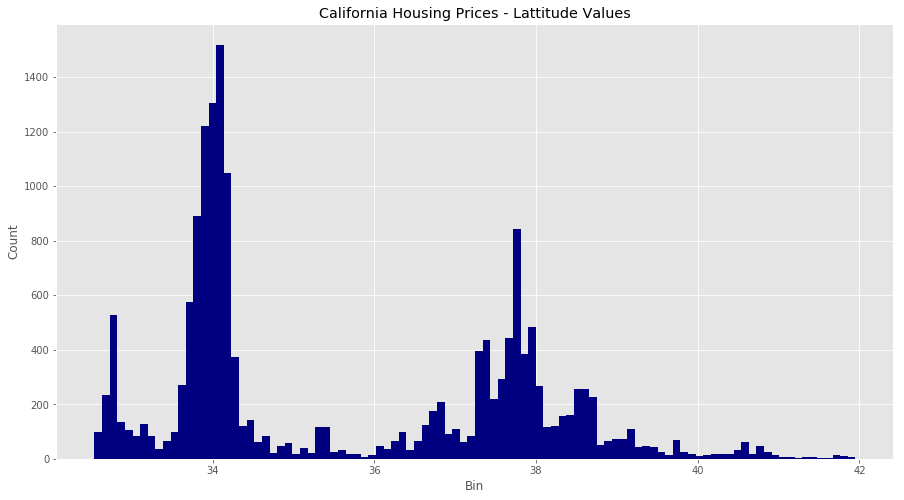
We’re going to made new columns for each latitude range, and encode each value in our dataset with a 0 or 1 to see if it is within that latitude range.
# Create range for your new columns
lat_range = zip(xrange(32, 44), xrange(33, 45))
new_df = pd.DataFrame()
# Iterate and create new columns, with the 0 and 1 encoding
for r in lat_range
        new_df["latitude_%d_to_%d" % r] = df["latitude"].apply(
            lambda l: 1.0 if l >= r[0] and l < r[1] else 0.0)
new_df
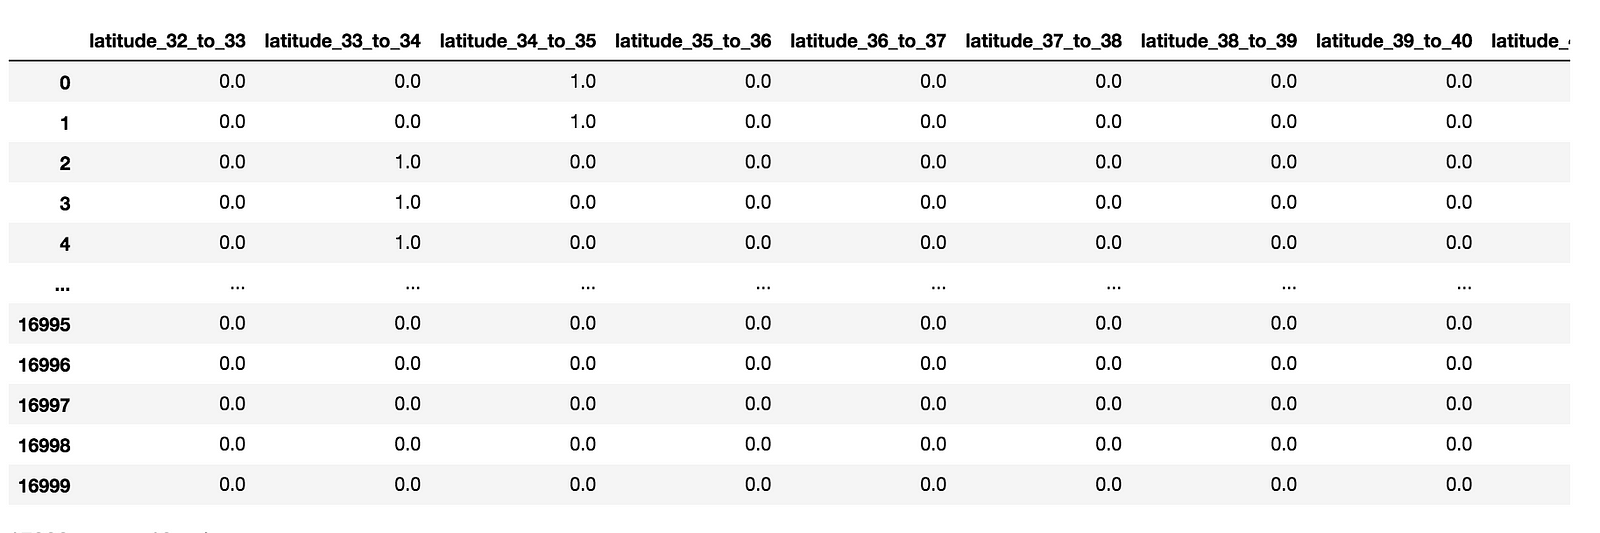
Values 0 and 1, are between 34 and 35. Values 2, 3, and 4, are between 33 and 34.
Now that we can binned values, we have a binary value for each latitude in California. With this additional approach, you have another way to clean your data and get it ready for modelling.
As always, I hoped this cleared up a few things and provided some concrete examples for you to work on.
Cheers
Additional Reading:
http://www.dataminingblog.com/standardization-vs-normalization/
http://www.faqs.org/faqs/ai-faq/neural-nets/part2/section-16.html
Normalization and Standardization both are rescaling techniques. They make your data unitless
Assume you have 2 feature F1 and F2.
F1 ranges from 0 - 100 , F2 ranges from 0 to 1.0
when you use the algorithm that uses distance as the measure. you encounter a problem.
F1 F2
20 0.2
26 0.2
20 0.9
row 1 - row 2 : (20 -26) + (0.2–0.2) = 6
row1 - row3 : ( 20–20 ) + (0.2 - 0.9) = 0.7
you may concluide row3 is nearest to row1 but its wrong .
right way of calculation is
row1- row2 : (20–26)/100 + (0.2 - 0.2)/1.0 = 0.06
row1 - row3 : (20–20)/100 + (0.2–0.9)/1.0 = 7
So row2 is the nearset to row1
Normalization brings data between 0- 1
Standardization brings data between 1 standardization
Normalization = ( X – Xmin) / (Xmax – Xmin)
Standardization = (x - µ ) / σ
Regularization is a concent of underfit and overfit
if an error is more in both train data and test data its underfit
if an error is more in test data and less train data it is overfit
Regularization is the way to manage optimal error
Feature scaling
Feature scaling is a method used to standardize the range of independent variables or features of data. In data processing, it is also known as data normalization and is generally performed during the data preprocessing step.
Contents
Motivation
Since the range of values of raw data varies widely, in some machine learning algorithms, objective functions will not work properly without normalization. For example, the majority of classifiers calculate the distance between two points by the Euclidean distance. If one of the features has a broad range of values, the distance will be governed by this particular feature. Therefore, the range of all features should be normalized so that each feature contributes approximately proportionately to the final distance.
Another reason why feature scaling is applied is that gradient descent converges much faster with feature scaling than without it.[1]
Methods
Rescaling (min-max normalization)
Also known as min-max scaling or min-max normalization, is the simplest method and consists in rescaling the range of features to scale the range in [0, 1] or [−1, 1]. Selecting the target range depends on the nature of the data. The general formula is given as:

where 

Mean normalization

where
Standardization
In machine learning, we can handle various types of data, e.g. audio signals and pixel values for image data, and this data can include multiple dimensions. Feature standardization makes the values of each feature in the data have zero-mean (when subtracting the mean in the numerator) and unit-variance. This method is widely used for normalization in many machine learning algorithms (e.g., support vector machines, logistic regression, and artificial neural networks)[2][citation needed]. The general method of calculation is to determine the distribution mean and standard deviation for each feature. Next we subtract the mean from each feature. Then we divide the values (mean is already subtracted) of each feature by its standard deviation.

Where 

Scaling to unit length
Another option that is widely used in machine-learning is to scale the components of a feature vector such that the complete vector has length one. This usually means dividing each component by the Euclidean length of the vector:

In some applications (e.g. Histogram features) it can be more practical to use the L1 norm (i.e. Manhattan Distance, City-Block Length or Taxicab Geometry) of the feature vector. This is especially important if in the following learning steps the Scalar Metric is used as a distance measure.
Application
In stochastic gradient descent, feature scaling can sometimes improve the convergence speed of the algorithm[2][citation needed]. In support vector machines,[3] it can reduce the time to find support vectors. Note that feature scaling changes the SVM result[citation needed].
See also
- fMLLR, Feature space Maximum Likelihood Linear Regression
References
- Juszczak, P.; D. M. J. Tax; R. P. W. Dui (2002). "Feature scaling in support vector data descriptions". Proc. 8th Annu. Conf. Adv. School Comput. Imaging: 25–30.
General references
- S. Aksoy and R. Haralick, "Feature normalization and likelihood-based similarity measures for image retrieval," Pattern Recognit. Lett., Special Issue on Image and Video Retrieval, 2000 http://www.cs.bilkent.edu.tr/~saksoy/papers/prletters01_likelihood.pdf
- S. Tsakalidis, V. Doumpiotis & W. Byrne, "Discriminative Linear Transforms for Feature Normalization and Speaker Adaptation in HMM Estimation", Proc. ICSLP'02, Denver. http://malach.umiacs.umd.edu/pubs/VD_05_Discrim_linear.pdf
- Liefeng Bo, Ling Wang, and Licheng Jiao, "Feature Scaling for Kernel Fisher Discriminant Analysis Using Leave-one-out Cross Validation", Neural Computation (NECO), vol. 18(4), pp. 961–978, 2006 http://www.cs.washington.edu/homes/lfb/paper/nc06.pdf
- A. Stolcke, S. Kajarekar, and L. Ferrer, "Nonparametric feature normalization for SVM-based speaker verification," in Proc. ICASSP, Las Vegas, Apr. 2008. http://ieeexplore.ieee.org/xpl/freeabs_all.jsp?arnumber=4517925
- Youn, E.; Jeong, M. K. (2009). "Class dependent feature scaling method using naive Bayes classifier for text datamining". Pattern Recognition Letters. 30: 477–485. doi:10.1016/j.patrec.2008.11.013.
- S. Theodoridis, K. Koutroumbas. (2008) “Pattern Recognition”, Academic Press, 4 edition, ISBN 978-1-59749-272-0
External links
- Ioffe, Sergey; Christian Szegedy (2015). "Batch Normalization: Accelerating Deep Network Training by Reducing Internal Covariate Shift". arXiv:1502.03167.
- Grus, Joel (2015). Data Science from Scratch. Sebastopol, CA: O'Reilly. pp. 99, 100. ISBN 978-1-491-90142-7.
Reference:
1. http://www.dataminingblog.com/standardization-vs-normalization/
2 https://stats.stackexchange.com/questions/10289/whats-the-difference-between-normalization-and-standardization
3. https://www.quora.com/What-is-the-difference-between-normalization-standardization-and-regularization-for-data
4.https://en.wikipedia.org/wiki/Feature_scaling
σxy
posted on 2018-10-18 04:32 Quinn-Yann 阅读(6472) 评论(0) 收藏 举报

 浙公网安备 33010602011771号