es磁盘使用水位线检查调整
前置,突然发现kibana无法使用了
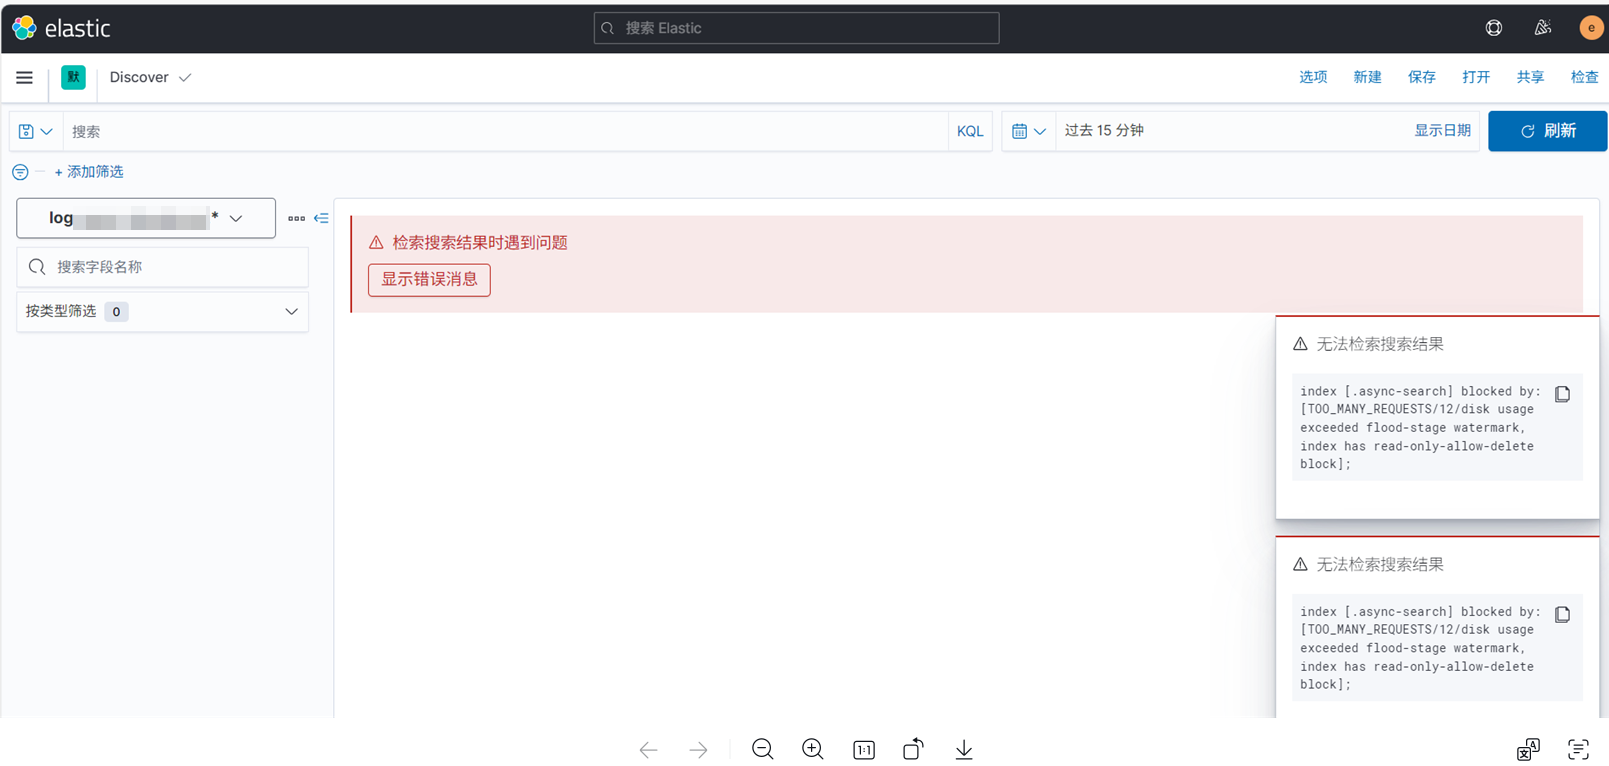
,随后就无法登录kibana了
检查:
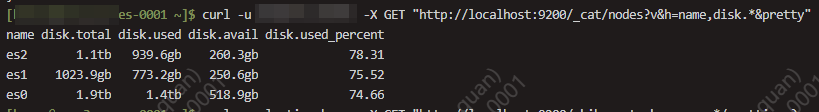
因为这里看的错误信息和磁盘有关,于是检查磁盘使用情况
发现才到75左右
所以只能想到是不是默认配置的磁盘水位线导致
disk usage exceeded flood-stage watermark
的告警和相关的现象
这里就检查水位线配置然后做相应的调整
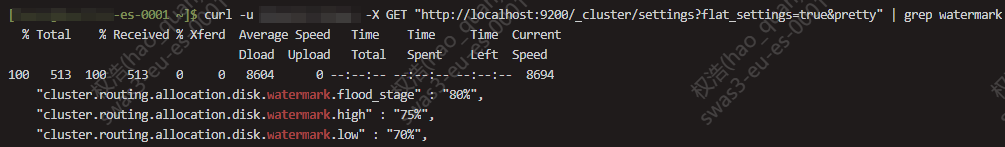
检查:
命令:
curl -X GET "http://localhost:9200/_cluster/settings?flat_settings=true&pretty" | grep watermark
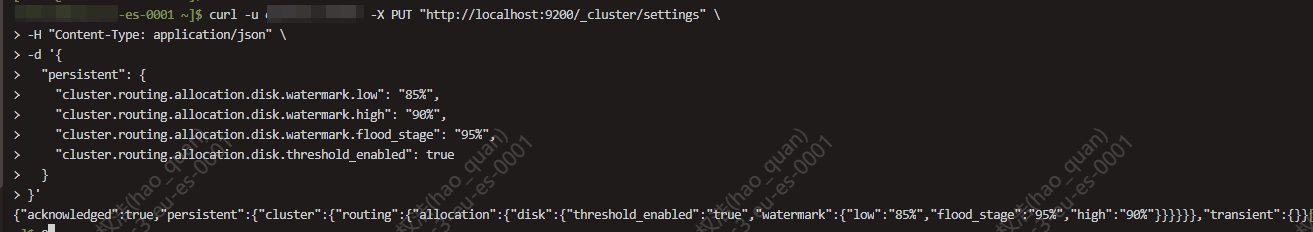
调整:
命令:
curl -X PUT "http://localhost:9200/_cluster/settings" \
-H "Content-Type: application/json" \
-d '{
  "persistent": {
    "cluster.routing.allocation.disk.watermark.low": "85%",
    "cluster.routing.allocation.disk.watermark.high": "90%",
    "cluster.routing.allocation.disk.watermark.flood_stage": "95%",
    "cluster.routing.allocation.disk.threshold_enabled": true
  }
}'
之后再回到kibana节点重启kibana
检查端口,登录kibana
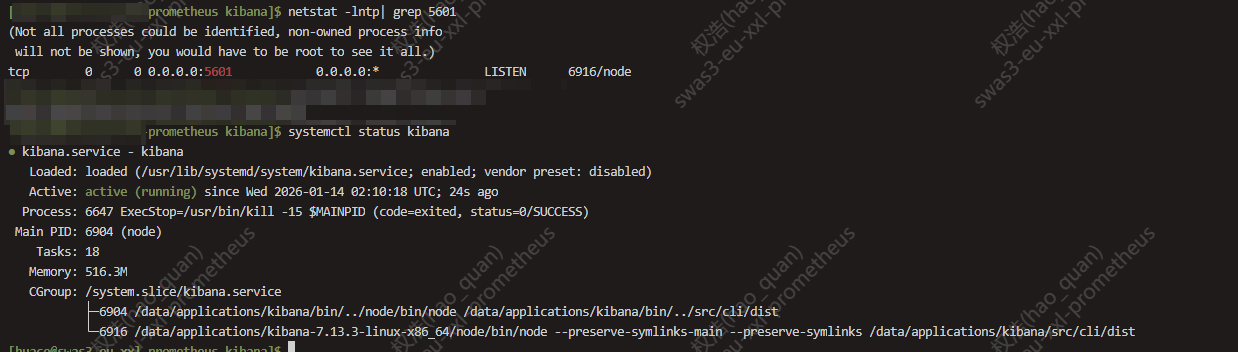
解决问题
本文来自博客园,作者:Unfool,转载请注明原文链接:https://www.cnblogs.com/queryH/p/19480708
本文版权归作者和博客园共有,欢迎转载,但未经作者同意必须在文章页面给出原文连接,否则保留追究法律责任的权利。

 浙公网安备 33010602011771号