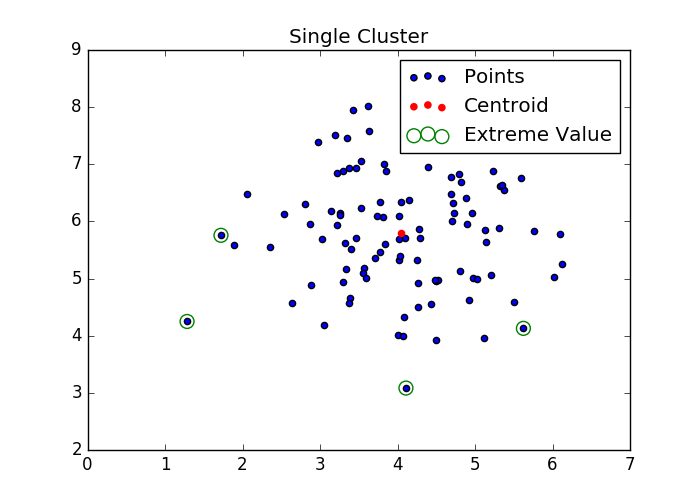
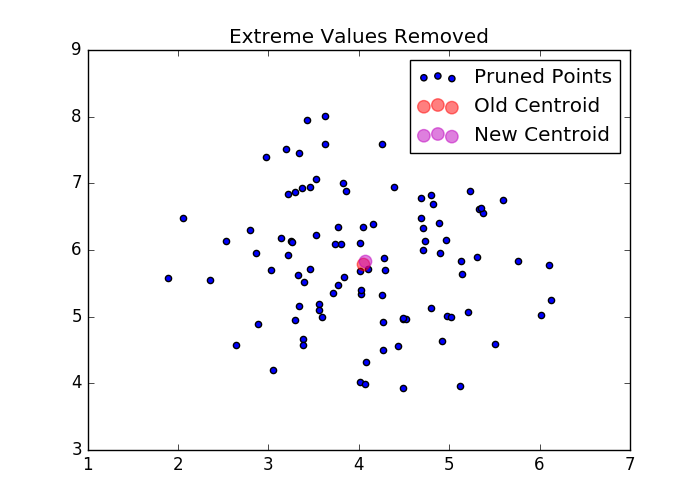
import matplotlib.pyplot as plt
from sklearn.datasets import make_blobs
import numpy as np

X,labels = make_blobs(100,centers=1)


from sklearn.cluster import KMeans
kmeans = KMeans(n_clusters=1)
kmeans.fit(X)

f, ax = plt.subplots(figsize=(7, 5))
ax.set_title("Blob")
ax.scatter(X[:, 0], X[:, 1], label='Points')
ax.scatter(kmeans.cluster_centers_[:, 0],kmeans.cluster_centers_[:, 1], label='Centroid',color='r')
ax.legend()
f.show()


distances = kmeans.transform(X)
# argsort returns an array of indexes which will sort the array in ascending order
# so we reverse it via [::-1] and take the top five with [:5]
#先把数组展开,逆向排序,选前5个,就是最外面的轮廓的索引
sorted_idx = np.argsort(distances.ravel())[::-1][:5]


#Now, let's see which plots are the farthest away:
f, ax = plt.subplots(figsize=(7, 5))
ax.set_title("Single Cluster")
ax.scatter(X[:, 0], X[:, 1], label='Points')
ax.scatter(kmeans.cluster_centers_[:, 0],kmeans.cluster_centers_[:, 1],label='Centroid', color='r')
ax.scatter(X[sorted_idx][:, 0], X[sorted_idx][:, 1],label='Extreme Value', edgecolors='g',facecolors='none', s=100)
ax.legend(loc='best')
f.show()

new_X = np.delete(X, sorted_idx, axis=0)

#Also, the centroid clearly changes with the removal of these points:
new_kmeans = KMeans(n_clusters=1)
new_kmeans.fit(new_X)
#Let's visualize the difference between the old and new centroids:
f, ax = plt.subplots(figsize=(7, 5))
ax.set_title("Extreme Values Removed")
ax.scatter(new_X[:, 0], new_X[:, 1], label='Pruned Points')
ax.scatter(kmeans.cluster_centers_[:, 0],kmeans.cluster_centers_[:, 1], label='Old Centroid',color='r', s=80, alpha=.5)
ax.scatter(new_kmeans.cluster_centers_[:, 0],new_kmeans.cluster_centers_[:, 1], label='New Centroid',color='m', s=80, alpha=.5)
ax.legend(loc='best')
f.show()


 浙公网安备 33010602011771号