iOS 图表工具charts之CandleStickChartView(K线)
关于charts的系列视图介绍传送门:
iOS 图表工具charts介绍
iOS 图表工具charts之LineChartView
iOS 图表工具charts之BarChartView
iOS 图表工具charts之PieChartView
iOS 图表工具charts之CandleStickChartView
iOS 图表工具charts之CombinedChartView
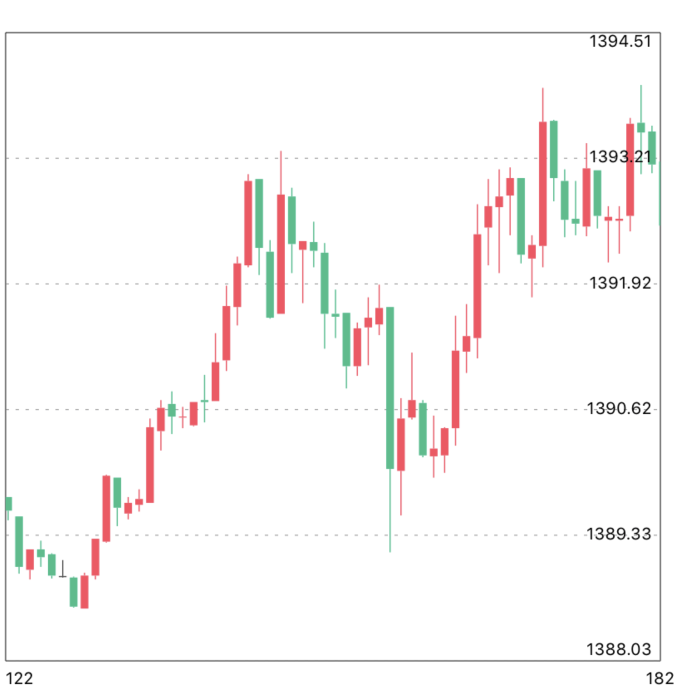
CandleStickChartView在charts中可以用来绘制K线图,由于charts是基于swift开发的,如果需要和objective-C混编(通过pod的方式不用管),可以参考我的上几篇文章iOS OC中桥接swift第三方库》,这里主要讲的是CandleStickChartView的一些常用属性和一些基本用法,实际情况以开发为准
CandleStickChartView的基本属性介绍
    CandleStickChartView *chartView = [[CandleStickChartView alloc] init];
    //设置偏移
    [chartView setExtraOffsetsWithLeft:10 top:10 right:10 bottom:10];
    //开启border
    chartView.drawBordersEnabled = YES;
    chartView.borderLineWidth = .5f;
    chartView.borderColor = UIColor.blackColor;
    //设置背景
    chartView.drawGridBackgroundEnabled = NO;
    chartView.gridBackgroundColor = [UIColor grayColor];
    //无内容显示
    chartView.noDataText = @"";
    //关闭描述
    chartView.chartDescription.enabled = NO;
    chartView.chartDescription.text = @"tiny`s kLineChart demo";
    //关闭图例
    chartView.legend.enabled = NO;
    //缩放
    chartView.scaleXEnabled = YES;
    chartView.scaleYEnabled = NO;
    chartView.autoScaleMinMaxEnabled = YES;
    chartView.highlightPerTapEnabled = YES;
    chartView.highlightPerDragEnabled = NO;
    chartView.pinchZoomEnabled = NO;  //手势捏合
    chartView.dragEnabled = YES;  //开启拖拽
    chartView.dragDecelerationFrictionCoef = 0.5;  //0 1 惯性
    chartView.doubleTapToZoomEnabled = NO;
    //代理
    chartView.delegate = self;

    //leftAxis
    ChartYAxis *rightAxis = chartView.rightAxis;
    rightAxis.enabled = YES;
    rightAxis.labelPosition = YAxisLabelPositionInsideChart;
    rightAxis.drawGridLinesEnabled = YES;
    rightAxis.gridLineDashLengths = @[@2,@4];
    rightAxis.labelTextColor = UIColor.blackColor;
    rightAxis.labelFont = [UIFont systemFontOfSize:10];
    rightAxis.decimals = 2;
    rightAxis.labelCount = 6;  //设置显示最大点数
    rightAxis.forceLabelsEnabled = YES;  //强制label个数
//    leftAxis.inverted = YES;
    //设置样式
    LeftAxisFormatter *leftFormatter = [LeftAxisFormatter new];
    leftFormatter.digital = 2;
    rightAxis.valueFormatter = leftFormatter;

    //rightAxis
    ChartYAxis *leftAxis = chartView.leftAxis;
    leftAxis.enabled = NO;

    //xAxis
    ChartXAxis *xAxis = chartView.xAxis;
    xAxis.enabled = YES;
    xAxis.labelPosition = XAxisLabelPositionBottom;
    xAxis.labelCount = 2;  //设置显示点数
    xAxis.forceLabelsEnabled = YES;  //强制label个数
    xAxis.avoidFirstLastClippingEnabled = YES;  //避免文字显示不全 这个属性很重要
    xAxis.granularityEnabled = YES;  //设置重复不显示
    //不画线
    xAxis.drawGridLinesEnabled = NO;
    xAxis.spaceMin = 0.5;
    xAxis.spaceMax = 0.5;
CandleChartDataEntry代码每个柱子图形
    NSMutableArray *array = [NSMutableArray array];
    for (int i = 0; i < datas.count; i++) {
        NSDictionary *dict = datas[i];
        double high = [dict[@"dbHighPrice"] doubleValue];
        double low = [dict[@"dbLowPrice"] doubleValue];
        double open = [dict[@"dbOpenPrice"] doubleValue];
        double close = [dict[@"dbClosePrice"] doubleValue];
        CandleChartDataEntry *entry = [[CandleChartDataEntry alloc] initWithX:(i) shadowH:high shadowL:low open:open close:close];
        [array addObject:entry];
    }
CandleChartDataSet代码所有的柱子的集合
    CandleChartDataSet *set = [[CandleChartDataSet alloc] initWithEntries:array label:@"kLine DataSet"];
    //下降颜色 是否填充填充
    set.decreasingColor = UIColorHex(0x32BE89);
    set.decreasingFilled = YES;
    //上升颜色 是否填充填充
    set.increasingColor = UIColorHex(0xFD4C60);
    set.increasingFilled = YES;
    //显示美国线
    //set.showCandleBar = NO;
    //阴影线的宽度 颜色跟随
    set.shadowWidth = 0.7;
    set.shadowColorSameAsCandle = YES;
    //k线柱间隙
    set.barSpace = 0.15;
    //是否现在十字标识
    set.drawHorizontalHighlightIndicatorEnabled = NO;
    set.drawVerticalHighlightIndicatorEnabled = NO;
    //轴线方向
    set.axisDependency = AxisDependencyRight;
    //不显数字
    set.drawValuesEnabled = NO;
CandleChartData
    //创建数据
    CandleChartData *candleData = [[CandleChartData alloc] initWithDataSet:set];
    //赋值
    self.chartView.data = candleData;
一些需要注意的点:
1.显示美国线
    CandleChartDataSet:
    set.showCandleBar = NO
2.影线的颜色跟随k线,这样就会根据k线值自动变成绿色或者红色
    CandleChartDataSet:
    set.shadowWidth = 0.7;
    set.shadowColorSameAsCandle = YES;
3.k线上升颜色,是否填充等属性,用来设置上升颜色下降颜色,是否是空心实心k线
    CandleChartDataSet:
    //下降颜色 是否填充填充
    set.decreasingColor = UIColorHex(0x32BE89);
    set.decreasingFilled = YES;
    //上升颜色 是否填充填充
    set.increasingColor = UIColorHex(0xFD4C60);
    set.increasingFilled = NO;
4.是否显示k线值
    CandleChartDataSet:
    //不显数字
    set.drawValuesEnabled = NO;
5.是否显示十字光标
    CandleChartDataSet:
    set.drawHorizontalHighlightIndicatorEnabled = NO;
    set.drawVerticalHighlightIndicatorEnabled = NO;
6.轴线方向 AxisDependencyRight 这样当我们滑动k线的时候k线会根据当前k线最大值和最小值调整缩放比例
    CandleChartDataSet:
    //轴线方向
    set.axisDependency = AxisDependencyRight;
7.k线设置缩放比例,最大缩放值 最小缩放值
    //最大缩放值 最小缩放值  y轴不缩放 minScl maxScl根据实际情况调整
    [self.chartView setScaleMinima:minScl scaleY:1];
    [self.chartView.viewPortHandler setMaximumScaleX:maxScl];
8.当前缩放比例设置
    CGAffineTransform srcMatrix = _chartView.viewPortHandler.touchMatrix;
    //scl根据实际情况设置当前缩放比例
    srcMatrix.a = scl;
    [self.chartView.viewPortHandler refreshWithNewMatrix:srcMatrix chart:self.chartView invalidate:YES];
9.k线移动到指定位置 第一次需要滚动到最新值
    //开局移动到最右边xMax为最大x轴值
    [self.chartView moveViewToX:self.chartView.data.xMax];
10.选中k线,拿到当前选中的点的x轴坐标,以便于拿到选中的model
//k线代理方法
-(void)chartValueSelected:(ChartViewBase *)chartView entry:(ChartDataEntry *)entry highlight:(ChartHighlight *)highlight{
     NSInteger index = highlight.x;
    //index为当前选中的x值
    if(index  < self.datas.count){
        //根据当前的index能拿到对应的数据模型
        Model *model = self.datas[index];
    }
}
其他待续

 浙公网安备 33010602011771号