
iOS 图表工具charts之LineChartView
关于charts的系列视图介绍传送门:
iOS 图表工具charts介绍
iOS 图表工具charts之LineChartView
iOS 图表工具charts之BarChartView
iOS 图表工具charts之PieChartView
iOS 图表工具charts之CandleStickChartView
iOS 图表工具charts之CombinedChartView
LineChartView在charts中可以用来绘制折线,由于charts是基于swift开发的,如果需要和objective-C混编(通过pod的方式不用管),可以参考我的上几篇文章《iOS OC中桥接swift第三方库》 ,这里主要讲的是LineChartView的一些常用属性和一些基本用法,实际情况以开发为准

lineChartView的一些属性介绍:
LineChartView *chartView = [[LineChartView alloc] init];
//设置间隙
[chartView setExtraOffsetsWithLeft:10 top:10 right:10 bottom:10];
//设置边框
chartView.borderColor = [UIColor blueColor];
chartView.borderLineWidth = .5;
chartView.drawBordersEnabled = YES;
//绘制网格背景
chartView.drawGridBackgroundEnabled = NO;
chartView.gridBackgroundColor = [UIColor grayColor];
//关于图表的描述
chartView.chartDescription.enabled = NO;
chartView.chartDescription.text = @"tiny`s charts demo";
//是否显示图例
chartView.legend.enabled = NO;
//没有数据时显示
chartView.noDataText = @"没有数据";
//x y轴是否支持拖拽
chartView.scaleXEnabled = YES;
chartView.scaleYEnabled = NO;
//是否支持xy轴同时缩放
chartView.pinchZoomEnabled = NO;
//是否支持双击缩放
chartView.doubleTapToZoomEnabled = NO;
//高亮点击
chartView.highlightPerTapEnabled = YES;
//高亮拖拽
chartView.highlightPerDragEnabled = YES;
//自动缩放
chartView.autoScaleMinMaxEnabled = YES;
//启用拖拽
chartView.dragEnabled = YES;
//代理方法
chartView.delegate = self;
//是否支持marker功能 这里可以自定义一个点击弹窗的marker
chartView.drawMarkers = YES;
ChartMarkerView * makerView = [[ChartMarkerView alloc]init];
makerView.chartView = chartView;
chartView.marker = makerView;
lineChartView可以设置坐标轴的属性 leftAxis,rightAxis,xAxis
ChartYAxis *leftAxis = chartView.leftAxis;
//是否使能left坐标轴
leftAxis.enabled = YES;
//坐标值在外部还是内部
leftAxis.labelPosition = YAxisLabelPositionInsideChart;
//最多显示的点数 默认为6
leftAxis.labelCount = 5;
//小数位
leftAxis.decimals = 2;
//是否要画网格线
leftAxis.drawGridLinesEnabled = YES;
//虚线相位
leftAxis.gridLineDashLengths = @[@2,@5];
//是否显示顶部底部坐标值
leftAxis.drawTopYLabelEntryEnabled = YES;
leftAxis.drawBottomYLabelEntryEnabled = YES;
//虚线宽度
// leftAxis.gridLineWidth = 20;
//设置重复不显示
leftAxis.granularityEnabled = YES;
leftAxis.granularity = YES;
//强制显示指定个数 使能了这个属性
// leftAxis.forceLabelsEnabled = YES;
//抗锯齿功能是否打开 默认打开状态
leftAxis.gridAntialiasEnabled = NO;
//坐标点居中
leftAxis.centerAxisLabelsEnabled = NO;
//绘制零线
// leftAxis.drawZeroLineEnabled = YES;
// leftAxis.zeroLineColor = [UIColor blueColor];
//轴线颜色 字体 线宽
leftAxis.axisLineColor = [UIColor redColor];
leftAxis.labelFont = [UIFont systemFontOfSize:10];
leftAxis.labelTextColor = [UIColor redColor];
leftAxis.axisLineWidth = 5;
// leftAxis.yOffset = -5;
//设置y轴上面显示格式 需要注意的是自定义的LeftAxisFormatter必须遵守IChartAxisValueFormatter协议,还需要重写-(NSString *)stringForValue:(double)value axis:(ChartAxisBase *)axis方法 具体后面会再讲解
leftAxis.valueFormatter = [LeftAxisFormatter new];
//bottom Axis
ChartXAxis *bmxAxis = chartView.xAxis;
bmxAxis.enabled = YES;
bmxAxis.labelPosition = XAxisLabelPositionBottom;
bmxAxis.valueFormatter = [AxisXFormatter new];
bmxAxis.drawGridLinesEnabled = YES;
// bmxAxis.xOffset = 10;
bmxAxis.labelCount = 5;
bmxAxis.forceLabelsEnabled = YES;
bmxAxis.avoidFirstLastClippingEnabled = YES; //避免文字显示不全 这个属性很重要
//设置最多显示点数
bmxAxis.axisMaximum = 40;
bmxAxis.axisMinimum = 0;
ChartDataEntry 点对象 折线上面的每个点都是一个ChartDataEntry对象
    NSArray *datas = @[@30,@40,@80,@70,@20,@20,@30,@9,@19,@99,@7,@89,@67,@56,@150];

    NSMutableArray *array = [NSMutableArray array];
    for (int i = 0; i < datas.count; i++) {
        //创建ChartDataEntry对象并将每个点对应的值与x轴 y轴进行绑定
        ChartDataEntry *entry = [[ChartDataEntry alloc] initWithX:i y:[datas[i] integerValue]];
        [array addObject:entry];
    }
LineChartDataSet 线 所有ChartDataEntry集合在一起就形成了线,LineChartDataSet的属性很多比如颜色,粗细,线宽,虚线,是否实现圆圈等等
    //创建一个集合并为这个集合赋值 label的值可为空
    LineChartDataSet *set = [[LineChartDataSet alloc] initWithEntries:array label:@"Line DataSet"];
    //折线颜色
    [set setColor:[UIColor grayColor]];
    set.lineWidth = .5;
    //这里模式可以用来设置线条的类型:比如折线,平滑曲线等
    set.mode = LineChartModeLinear;
    //使能小圆圈 默认使能 通过圆圈和Hole可以画出空心圆的效果,这个在k线指标DKBY图中会用到的
    set.drawCirclesEnabled = NO;
    //圆圈半径
    set.circleRadius = 2.5;
    //圆圈颜色
    set.circleColors = @[UIColor.redColor];
    //使能圆圈孔
    set.drawCircleHoleEnabled = YES;
    //圆圈孔中心颜色
    set.circleHoleColor = [UIColor clearColor];
    //圆孔孔中心半径 这个半径要比圆圈半径小才可以看到空心圆效果
    set.circleHoleRadius = 2.f;
    set.lineDashPhase = .5f;
     set.lineDashLengths = @[@.5f];
    set.axisDependency = AxisDependencyRight;
//    set.lineCapType = kCGLineCapRound;
    //使能填充 填充效果可以达到股票交易软件中分时图的效果
    set.drawFilledEnabled = NO;

    set.drawValuesEnabled = NO;
    //取消高亮点击,如果设置为NO则线上所有点将无法点击 这个属性设置一定要注意
//    set.highlightEnabled = NO;
    //取消横向纵向辅助线
//    set.drawHorizontalHighlightIndicatorEnabled = NO;
//    set.drawVerticalHighlightIndicatorEnabled = NO;

    //设置填充颜色
//    set.fillColor = [UIColor redColor];
LineChartData 数据容器 将前面准备的set添加到容器中,这样图表就可以显示出来了
//创建容器
    LineChartData *chartData = [[LineChartData alloc] initWithDataSet:set];
//将数据添加到图中 注意这里可以是多条线  [chartData addDataSet:set]
    self.chartView.data = chartData;
delegate chartView是有代理的
#pragma mark 图表中数值被选中
-(void)chartValueSelected:(ChartViewBase *)chartView entry:(ChartDataEntry *)entry highlight:(ChartHighlight *)highlight{

//    NSLog(@"图表中数值被选中");
    [self.maskView updateMaskValue:entry.y];
}

#pragma mark 图表中的空白区域被选中
-(void)chartValueNothingSelected:(ChartViewBase *)chartView{
//    NSLog(@"空白区域被选中");
}

#pragma mark 图表被缩放
-(void)chartScaled:(ChartViewBase *)chartView scaleX:(CGFloat)scaleX scaleY:(CGFloat)scaleY{
//    NSLog(@"图表被缩放");
}

#pragma mark 图表被移动
-(void)chartTranslated:(ChartViewBase *)chartView dX:(CGFloat)dX dY:(CGFloat)dY{
//    NSLog(@"图表被移动");
}
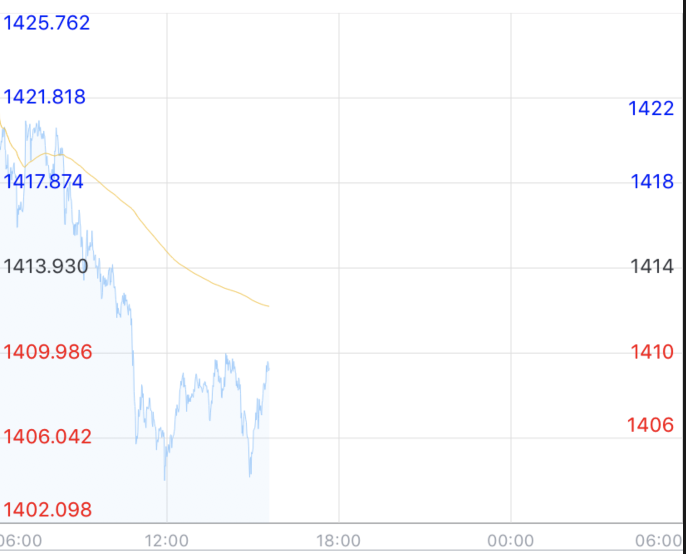
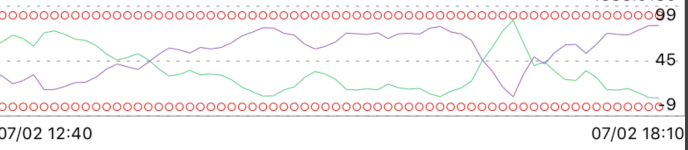
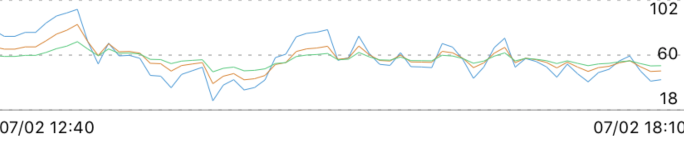
在我的项目中lineChartView主要用来绘制分时图和一些指标图形,所有这里就截了几个图以供参考
//分时图
//指标
//指标
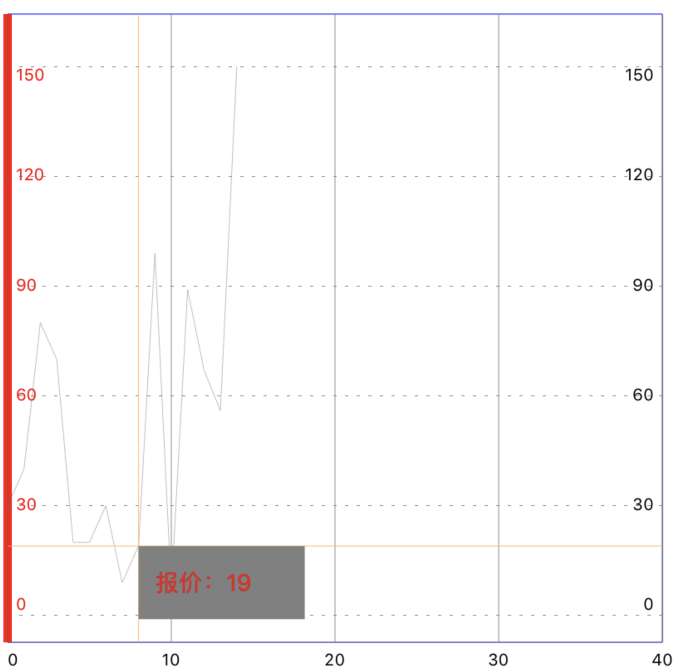
//点击可以弹出浮层的效果
可能遇到的坑
1.辅助线 默认是有辅助线的(也就是十字线),如果不需要可以设置
    set.drawHorizontalHighlightIndicatorEnabled = NO;
    set.drawVerticalHighlightIndicatorEnabled = NO;
2.折线上面的点无法点击,如果设置了set.highlightEnabled = NO,将无法点击
3.设置点击浮层,每个点点击如果需要有浮层弹出,其实是可以自定义mask的,设置方法:
    //是否支持marker功能
    chartView.drawMarkers = YES;
    ChartMarkerView * makerView = [[ChartMarkerView alloc]init];
    makerView.chartView = chartView;
    chartView.marker = makerView;
    //maskView是自定义的UI
    MaskView *masker = [[MaskView alloc] initWithFrame:CGRectMake(0, 0, 100, 44)];
    [makerView addSubview:masker];
    self.maskView = masker;

    //当用户点击了可以在代理中监听点击的点,拿到点对应的值,更新maskView就可以了
    -(void)chartValueSelected:(ChartViewBase *)chartView entry:(ChartDataEntry *)entry highlight:(ChartHighlight *)highlight{
        [self.maskView updateMaskValue:entry.y];
    }
4.坐标轴formatter的设置,需要创建一个对象,准守IChartAxisValueFormatter协议,实现-(NSString *)stringForValue:(double)value axis:(ChartAxisBase *)axis方法即可,以LeftAxisFormatter为例
//LeftAxisFormatter.h
#import <Foundation/Foundation.h>
#import <ChartsDemo-Swift.h>

NS_ASSUME_NONNULL_BEGIN

@interface LeftAxisFormatter : NSObject<IChartAxisValueFormatter>

//小数位
@property(nonatomic, assign) int digital;

@end

//LeftAxisFormatter.m
#import "LeftAxisFormatter.h"

NS_ASSUME_NONNULL_END

@implementation LeftAxisFormatter

-(NSString *)stringForValue:(double)value axis:(ChartAxisBase *)axis{
    return  [NSString stringWithFormat:[NSString stringWithFormat:@"%%.%if", self.digital] , value];
}

@end
5.chartView坐标轴左右上下默认都会有间隙的 可以通过以下方式清除间隙
    [chartView setExtraOffsetsWithLeft:10 top:10 right:10 bottom:10];
     chartView.minOffset = 0;
6.leftAxis默认会绘制6个label,如果需要改变labels的数量,则需要通过以下方法设置
 //最多显示的点数 默认为6
    leftAxis.labelCount = 5;
    //强制显示指定个数 使能了这个属性
// leftAxis.forceLabelsEnabled = YES;
7.oc中如果修改charts源码,就需要桥接swift了,这个时候请参考我的这篇文章《iOS OC中桥接swift第三方库》
8.发现x坐标轴数字显示不全设置 avoidFirstLastClippingEnabled = YES即可
9.LineChartDataSet的drawCirclesEnabled可以让每个点显示小圆圆
10.折线上面每个点的数字无法显示
1.设置chartView.maxVisibleCount = 100 100表示chartView最多显示100个点值 0表示不显示点值
2.设置set.drawValuesEnabled = YES;
set.valueColors = @[[UIColor redColor]];
set.valueFont = [UIFont systemFontOfSize:12];
11.空心圆的显示技巧,指标上面要显示空心圆
1.设置set.drawCirclesEnabled = YES;
2.设置圆圈半径set.circleRadius = 2.5;
3.设置颜色set.circleColors = @[UIColor.redColor];
4.使能空心圆set.drawCircleHoleEnabled = YES
5.设置 set.circleHoleRadius = 2.f;这里半径一定要比circle小 (很重要要不然显示不出来)
6.设置set.circleHoleColor = [UIColor clearColor],设置空心圆的颜色为透明
设置完以上就可以看到一个半径为2.f的空心外圈颜色为红色的空心圆了
其他:暂时只想到这些,后续遇到了还会陆续添加

 浙公网安备 33010602011771号