学习笔记与雷达图
numpy的读书笔记:
1.创建ndarray:
# 列表转换
data1 = [6, 7.5, 8, 0, 1]
arr1 = np.array(data1)
# 嵌套序列
data2 = [[1,2,3,4],[5,6,7,8]]
arr2 = np.array(data2)
np.zeros(10)
np.zeros((3,6))
np.empty((2,3,2))
np.arange(15)
ndarray的数据类型:
# 创建的时候指定类型
arr1 = np.array([1,2,3], dtype=np.float64) #双精度浮点
arr2 = np.array([1,2,3], dtype=np.int32)
matplotlib读书笔记:
-
from pylab import *
-
from numpy import *
-
x = linspace(0, 5, 10)
-
y = x ** 2
-
figure()
-
plot(x, y, 'r')
-
xlabel('x')
-
ylabel('y')
-
title('title')#创建子图,选择绘图用的颜色与符号subplot(1,2,1)plot(x, y, 'r--')subplot(1,2,2)plot(y, x, 'g*-');雷达图:
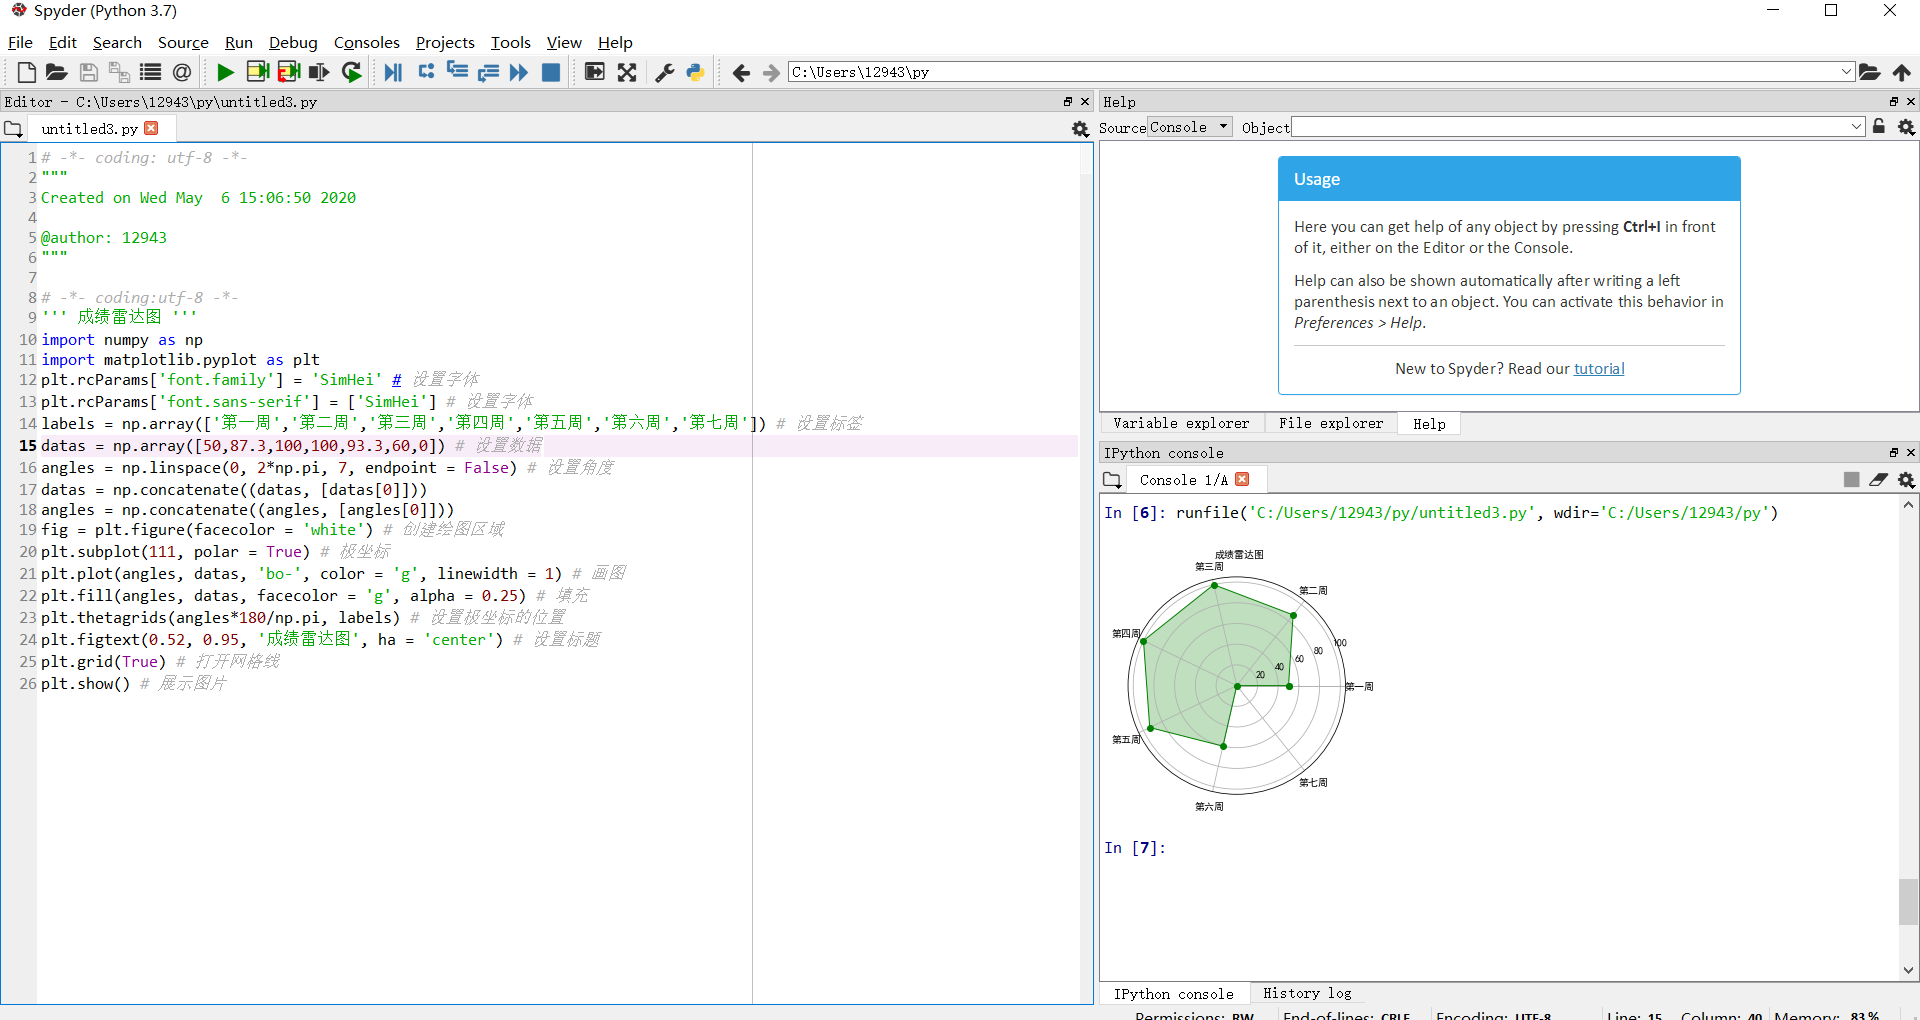
import numpy as np
import matplotlib.pyplot as plt
plt.rcParams['font.family'] = 'SimHei'
plt.rcParams['font.sans-serif'] = ['SimHei']
labels = np.array(['第一周','第二周','第三周','第四周','第五周','第六周','第七周'])
datas = np.array([50,87.3,100,100,93.3,60,0])
angles = np.linspace(0, 2*np.pi, 7, endpoint = False)
datas = np.concatenate((datas, [datas[0]]))
angles = np.concatenate((angles, [angles[0]]))
fig = plt.figure(facecolor = 'white')
plt.subplot(111, polar = True)
plt.plot(angles, datas, 'bo-', color = 'g', linewidth = 1)
plt.fill(angles, datas, facecolor = 'g', alpha = 0.25)
plt.thetagrids(angles*180/np.pi, labels)
plt.figtext(0.52, 0.95, '成绩雷达图', ha = 'center')
plt.grid(True)
plt.show()
![]()

 浙公网安备 33010602011771号