
5.JVM--重新认识JVM及GC优化
01 JVM终结篇
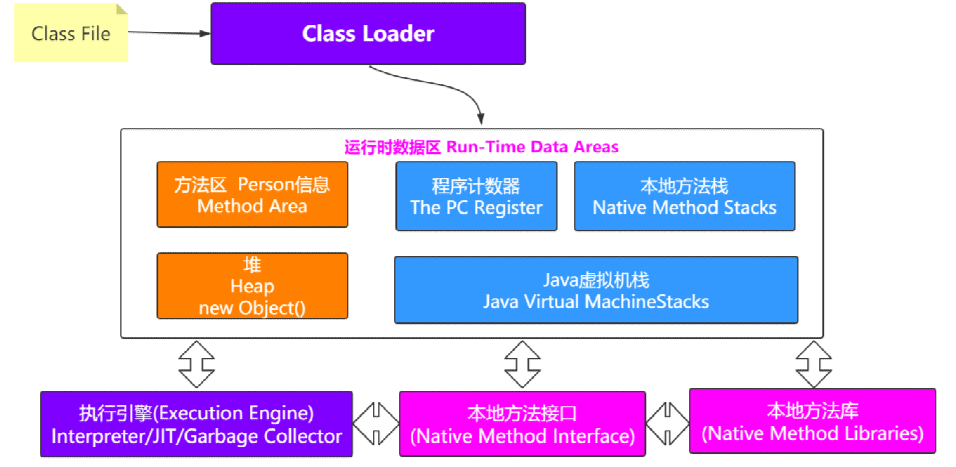
1.1 重新认知JVM
1.2 GC优化
内存被使用了之后,难免会有不够用或者达到设定值的时候,就需要对内存空间进行垃圾回收。
1.2.1 垃圾收集发生的时机
GC是由JVM自动完成的,根据JVM系统环境而定,所以时机是不确定的。 当然,我们可以手动进行垃圾回收,
比如调用System.gc()方法通知JVM进行一次垃圾回收,但是具体什么时刻运行也无法控制。也就是说
System.gc()只是通知要回收,什么时候回收由JVM决定。 但是不建议手动调用该方法,因为消耗的资源比较 大。
一般以下几种情况会发生垃圾回收
(1)当Eden区或者S区不够用了
(2)老年代空间不够用了
(3)方法区空间不够用了
(4)System.gc()
1.2.2 准备项目

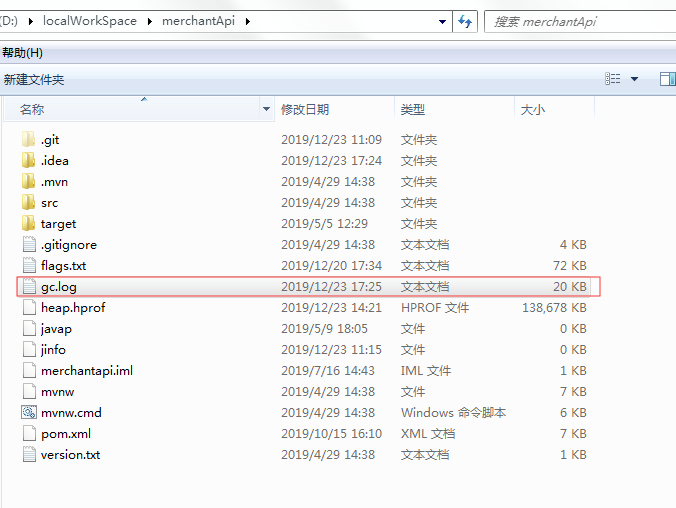
1.2.3 GC日志文件
要想分析日志的信息,得先拿到GC日志文件才行,所以得先配置一下,之前也看过这些参数。
-XX:+PrintGCDetails -XX:+PrintGCTimeStamps -XX:+PrintGCDateStamps -Xloggc:gc.log
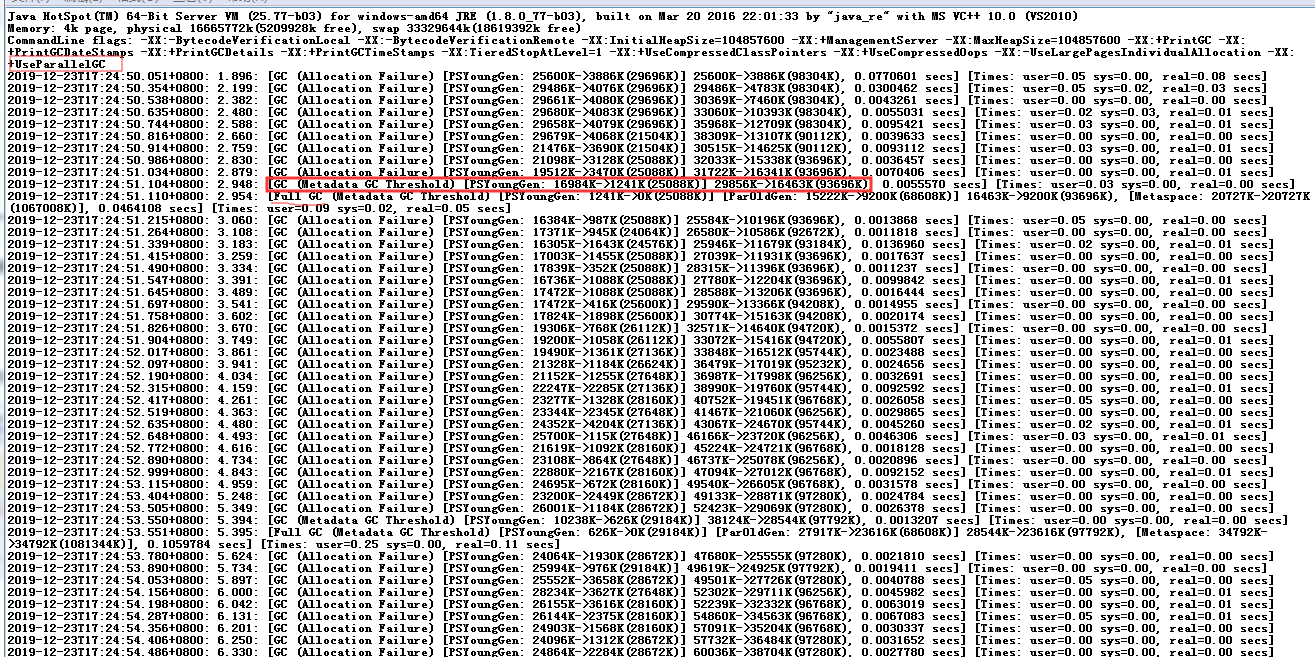
然后启动项目
可以看到默认Young区使用的是ParallelGC 匹配old区 ParOldGen
1.2.3.1 Parallel GC日志
【吞吐量优先】
2019-06-10T23:21:53.305+0800: 1.303:
[GC (Allocation Failure) [PSYoungGen: 65536K[Young区回收前]->10748K[Young区回收后]
(76288K[Young区总大小])] 65536K[整个堆回收前]->15039K[整个堆回收后](251392K[整个堆总大小]), 0.0113277 secs] [Times: user=0.00 sys=0.00, real=0.01 secs]
注意 如果回收的差值中间有出入,说明这部分空间是Old区释放出来的
1.2.3.2 CMS日志
【停顿时间优先】

参数设置:-XX:+UseConcMarkSweepGC -Xloggc:cms-gc.log
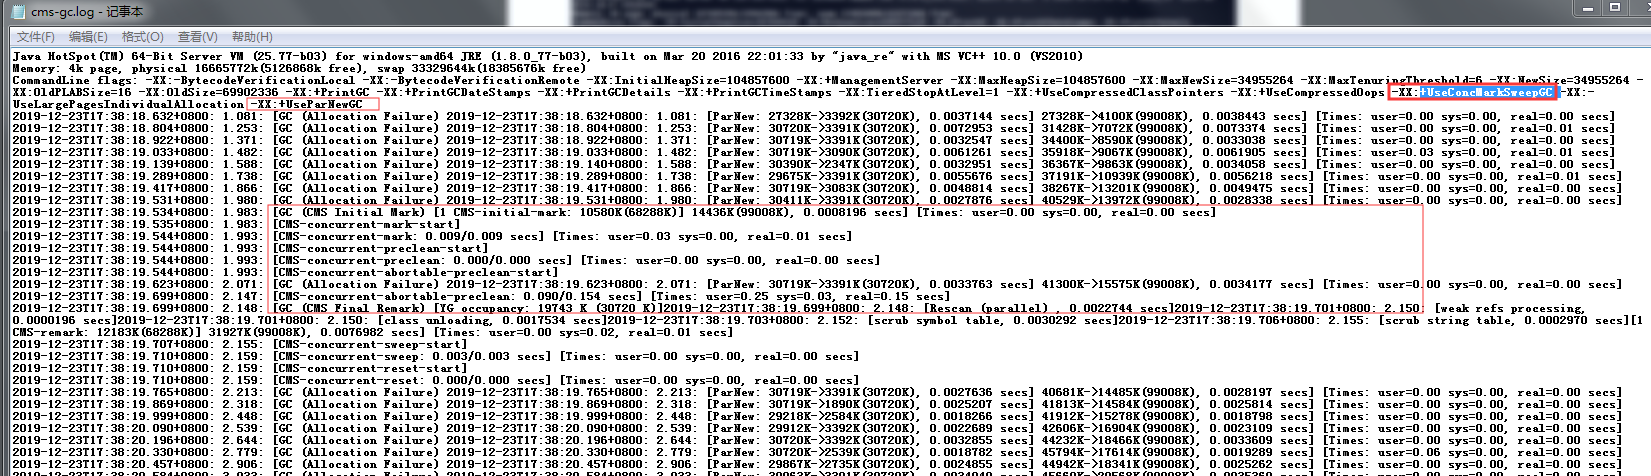
CMS的清理过程

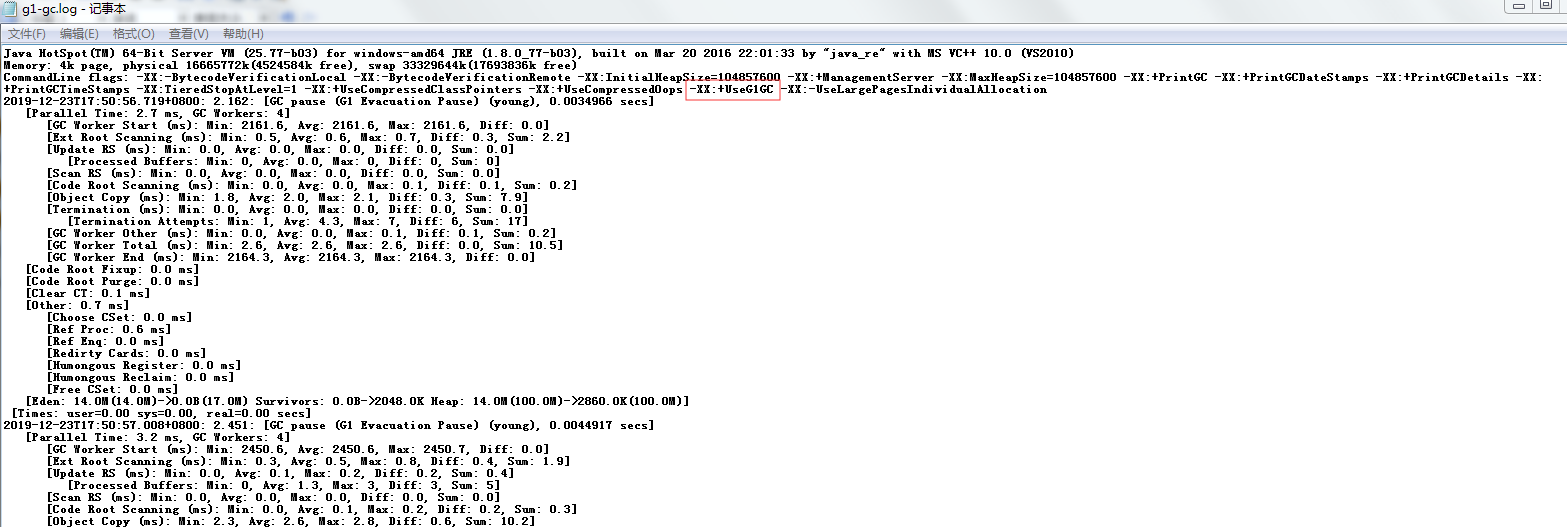
1.2.3.3 G1日志
【停顿时间优先】
参数设置:-XX:+UseG1GC -Xloggc:g1-gc.log

理解G1日志格式:https://blogs.oracle.com/poonam/understanding-g1-gc-logs
-XX:+UseG1GC # 使用了G1垃圾收集器
# 什么时候发生的GC,相对的时间刻,GC发生的区域young,总共花费的时间,0.00478s, # It is a stop-the-world activity and all # the application threads are stopped at a safepoint during this time.
2019-12-18T16:06:46.508+0800: 0.458: [GC pause (G1 Evacuation Pause) (young),0.0047804 secs]
# 多少个垃圾回收线程,并行的时间
[Parallel Time: 3.0 ms, GC Workers: 4]
# GC线程开始相对于上面的0.458的时间刻
[GC Worker Start (ms): Min: 458.5, Avg: 458.5, Max: 458.5, Diff: 0.0]
# This gives us the time spent by each worker thread scanning the roots
# (globals, registers, thread stacks and VM data structures).
[Ext Root Scanning (ms): Min: 0.2, Avg: 0.4, Max: 0.7, Diff: 0.5, Sum: 1.7]
# Update RS gives us the time each thread spent in updating the Remembered Sets. [Update RS (ms): Min: 0.0, Avg: 0.0, Max: 0.0, Diff: 0.0, Sum: 0.0]
...
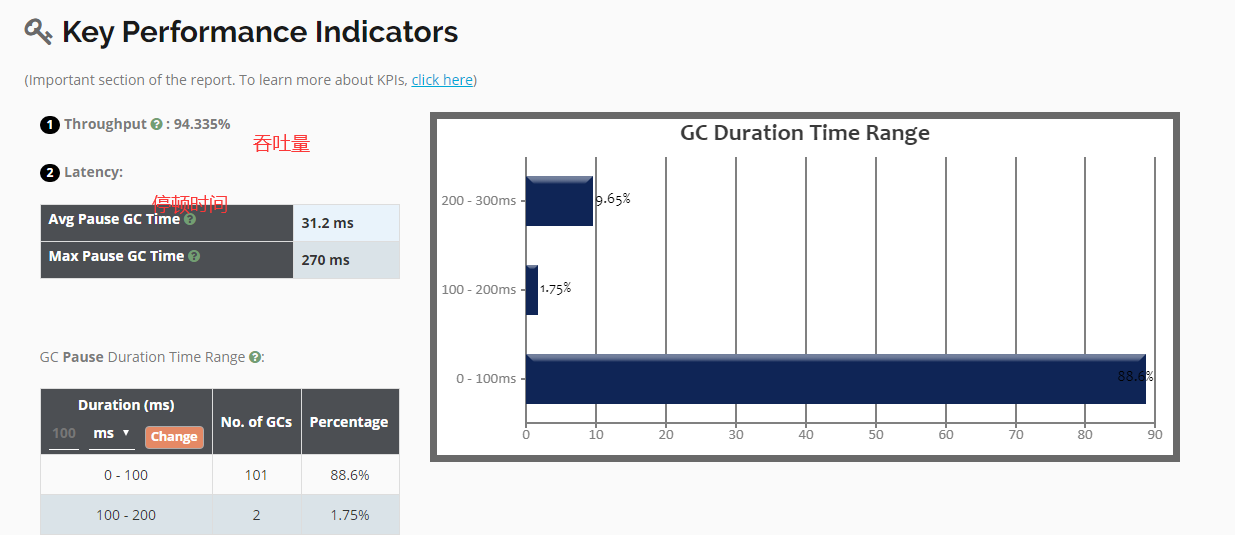
1.2.4 GC日志文件分析工具
1.2.4.1 gceasy
官网:https://gceasy.io
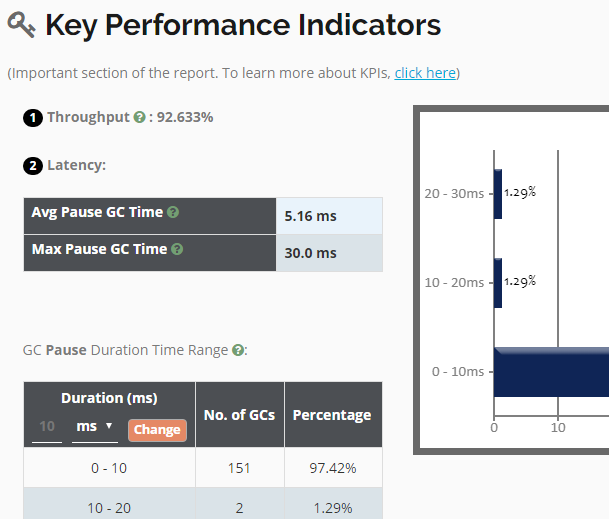
可以比较不同的垃圾收集器的吞吐量和停顿时间
比如打开cms-gc.log和g1-gc.log
CMS 吞吐量 94.335% 平均停顿时间 31.2 ms
G1 吞吐量 92.633% 平均停顿时间 5.16 ms
1.2.4.2 GCViewer

1.2.5 G1调优与最佳指南
1.2.5.1 调优
Recommended Use Cases for G1
The first focus of G1 is to provide a solution for users running applications that require large heaps with limited GC latency. This means heap sizes of around 6GB or larger, and stable and predictable pause time below 0.5 seconds.
Applications running today with either the CMS or the ParallelOld garbage collector would benefit switching to G1 if the application has one or more of the following traits.
- More than 50% of the Java heap is occupied with live data.
- The rate of object allocation rate or promotion varies significantly.
- Undesired long garbage collection or compaction pauses (longer than 0.5 to 1 second)
是否选用G1垃圾收集器的判断依据
官方建议:https://docs.oracle.com/javase/8/docs/technotes/guides/vm/G1.html#use_cases(1)50%以上的堆被存活对象占用
(2)对象分配和晋升的速度变化非常大
(3)垃圾回收时间比较长
思考:G1适用于大堆(>5G) https://blogs.oracle.com/poonam/increased-heap-usage-with-g1-gc
For example, in an experimental run with CMS using a heap size of 8GB,
the maximum observed heap usage was around 4GB.
But after switching to G1,
with -XX:MaxGCPauseMillis=50,
the heap usage went up to 6GB.
In both the cases, the application load was same.
(1)使用G1GC垃圾收集器: -XX:+UseG1GC
修改配置参数,获取到gc日志,使用GCViewer分析吞吐量和响应时间
Throughput Min Pause Max Pause Avg Pause GC count
99.16% 0.00016s 0.0137s 0.00559s 12
(2)调整内存大小再获取gc日志分析
-XX:MetaspaceSize=100M
-Xms300M
-Xmx300M
比如设置堆内存的大小,获取到gc日志,使用GCViewer分析吞吐量和响应时间
Throughput Min Pause Max Pause Avg Pause GC count
98.89% 0.00021s 0.01531s 0.00538s 12
(3)调整最大停顿时间
-XX:MaxGCPauseMillis=20 设置最大GC停顿时间指标
比如设置最大停顿时间,获取到gc日志,使用GCViewer分析吞吐量和响应时间
Throughput Min Pause Max Pause Avg Pause GC count
98.96% 0.00015s 0.01737s 0.00574s 12
(4)启动并发GC时堆内存占用百分比
-XX:InitiatingHeapOccupancyPercent=45 G1用它来触发并发GC周期,基于整个堆的使用率,而不只是某一代内存的 使用比例。值为 0 则表示“一直执行GC循环)'. 默认值为 45 (例如, 全部的 45% 或者使用了45%).
比如设置该百分比参数,获取到gc日志,使用GCViewer分析吞吐量和响应时间
Throughput Min Pause Max Pause Avg Pause GC count
98.11% 0.00406s 0.00532s 0.00469s 12
1.2.5.2 最佳指南
官网建议: https://docs.oracle.com/javase/8/docs/technotes/guides/vm/gctuning/g1_gc_tuning.html#recomm endations
When you evaluate and fine-tune G1 GC, keep the following recommendations in mind:
Young Generation Size: Avoid explicitly setting young generation size with the
-Xmnoption or any or other related option such as-XX:NewRatio. Fixing the size of the young generation overrides the target pause-time goal.
Pause Time Goals: When you evaluate or tune any garbage collection, there is always a latency versus throughput trade-off. The G1 GC is an incremental garbage collector with uniform pauses, but also more overhead on the application threads. The throughput goal for the G1 GC is 90 percent application time and 10 percent garbage collection time. Compare this to the Java HotSpot VM parallel collector. The throughput goal of the parallel collector is 99 percent application time and 1 percent garbage collection time. Therefore, when you evaluate the G1 GC for throughput, relax your pause time target. Setting too aggressive a goal indicates that you are willing to bear an increase in garbage collection overhead, which has a direct effect on throughput. When you evaluate the G1 GC for latency, you set your desired (soft) real-time goal, and the G1 GC will try to meet it. As a side effect, throughput may suffer. See the section Pause Time Goal in Garbage-First Garbage Collector for additional information.
Taming Mixed Garbage Collections: Experiment with the following options when you tune mixed garbage collections. See the section Important Defaults for information about these options:
-XX:InitiatingHeapOccupancyPercent: Use to change the marking threshold.
-XX:G1MixedGCLiveThresholdPercentand-XX:G1HeapWastePercent: Use to change the mixed garbage collection decisions.
-XX:G1MixedGCCountTargetand-XX:G1OldCSetRegionThresholdPercent: Use to adjust the CSet for old regions.
(1)不要手动设置新生代和老年代的大小,只要设置整个堆的大小
G1收集器在运行过程中,会自己调整新生代和老年代的大小
其实是通过adapt代的大小来调整对象晋升的速度和年龄,从而达到为收集器设置的暂停时间目标 如果手动设置了大小就意味着放弃了G1的自动调优
(2)不断调优暂停时间目标
一般情况下这个值设置到100ms或者200ms都是可以的(不同情况下会不一样),但如果设置成50ms就不太合理。暂停 时间设置的太短,就会导致出现G1跟不上垃圾产生的速度。
最终退化成Full GC。所以对这个参数的调优是一个持续 的过程,逐步调整到最佳状态。暂停时间只是一个目标,并不能总是得到满足。
(3)使用-XX:ConcGCThreads=n来增加标记线程的数量
IHOP如果阀值设置过高,可能会遇到转移失败的风险,比如对象进行转移时空间不足。如果阀值设置过低,就会使标 记周期运行过于频繁,并且有可能混合收集期回收不到空间。
IHOP值如果设置合理,但是在并发周期时间过长时,可以尝试增加并发线程数,调高ConcGCThreads。
(4)MixedGC调优
-XX:InitiatingHeapOccupancyPercent -XX:G1MixedGCLiveThresholdPercent
-XX:G1MixedGCCountTarger
-XX:G1OldCSetRegionThresholdPercent
(5)适当增加堆内存大小
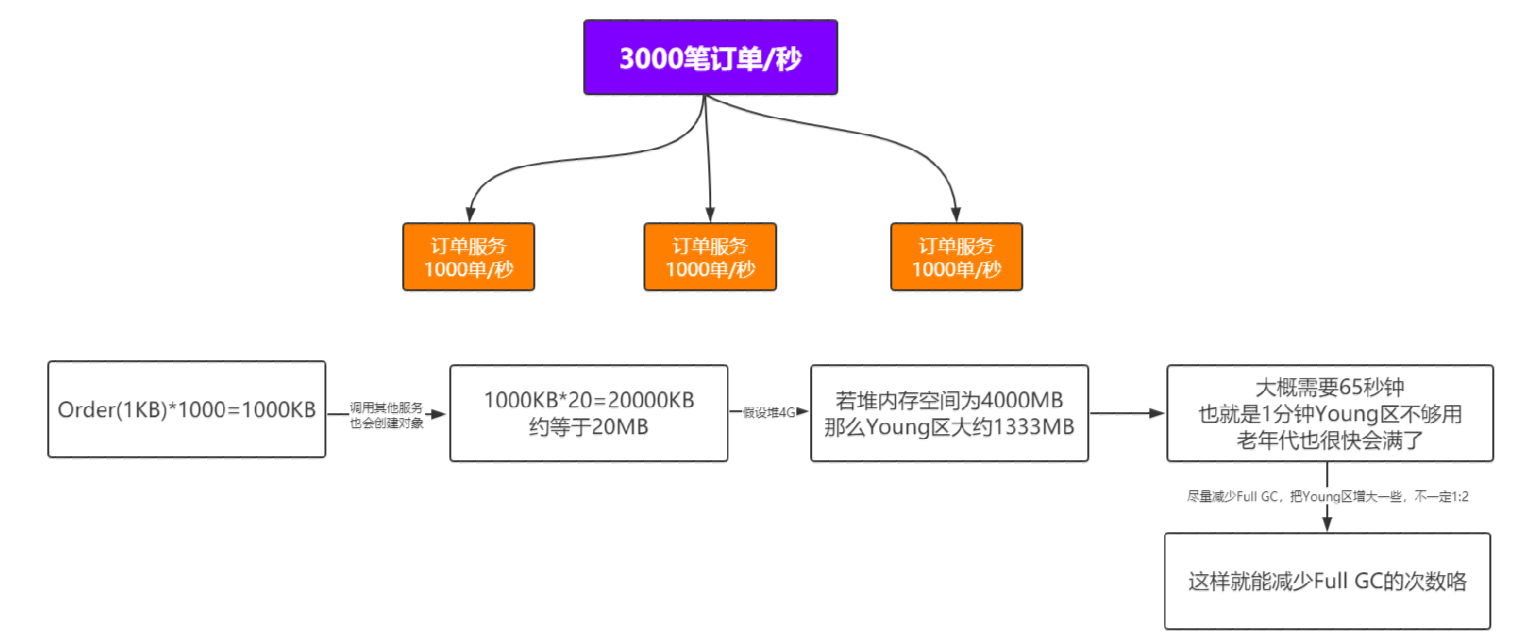
10.3 高并发场景分析
以每秒3000笔订单为例
10.4 JVM性能优化指南

10.5 常见问题思考
(1)内存泄漏与内存溢出的区别
内存泄漏:对象无法得到及时的回收,持续占用内存空间,从而造成内存空间的浪费。
内存溢出:内存泄漏到一定的程度就会导致内存溢出,但是内存溢出也有可能是大对象导致的。
(2)young gc会有stw吗?
不管什么 GC,都会有 stop-the-world,只是发生时间的长短。
(3)major gc和full gc的区别
major gc指的是老年代的gc,而full gc等于young+old+metaspace的gc。
(4)G1与CMS的区别是什么
CMS 用于老年代的回收,而 G1 用于新生代和老年代的回收。
G1 使用了 Region 方式对堆内存进行了划分,且基于标记整理算法实现,整体减少了垃圾碎片的产生。
(5)什么是直接内存
直接内存是在java堆外的、直接向系统申请的内存空间。通常访问直接内存的速度会优于Java堆。因此出于性能的考 虑,读写频繁的场合可能会考虑使用直接内存。
(6)不可达的对象一定要被回收吗?
即使在可达性分析法中不可达的对象,也并非是“非死不可”的,这时候它们暂时处于“缓刑阶段”,要真正宣告一个对 象死亡,至少要经历两次标记过程;可达性分析法中不可达的对象被第一次标记并且进行一次筛选,
筛选的条件是此 对象是否有必要执行 finalize 方法。当对象没有覆盖 finalize 方法,或 finalize 方法已经被虚拟机调用过时,虚拟机 将这两种情况视为没有必要执行。
被判定为需要执行的对象将会被放在一个队列中进行第二次标记,除非这个对象与引用链上的任何一个对象建立关 联,否则就会被真的回收。
(7)方法区中的无用类回收
方法区主要回收的是无用的类,那么如何判断一个类是无用的类的呢?
判定一个常量是否是“废弃常量”比较简单,而要判定一个类是否是“无用的类”的条件则相对苛刻许多。类需要同时满 足下面 3 个条件才能算是 “无用的类” :
该类所有的实例都已经被回收,也就是 Java 堆中不存在该类的任何实例。
加载该类的 ClassLoader 已经被回收。
该类对应的 java.lang.Class 对象没有在任何地方被引用,无法在任何地方通过反射访问该类的方法。
虚拟机可以对满足上述 3 个条件的无用类进行回收,这里说的仅仅是“可以”,而并不是和对象一样不使用了就会必然 被回收。
(8)不同的引用
JDK1.2以后,Java对引用进行了扩充:强引用、软引用、弱引用和虚引用

 浙公网安备 33010602011771号