
Linux部署GPE
GPE监控预警系统
GPE监控预警系统结构图,包括Grafana+Prometheus+Exporter
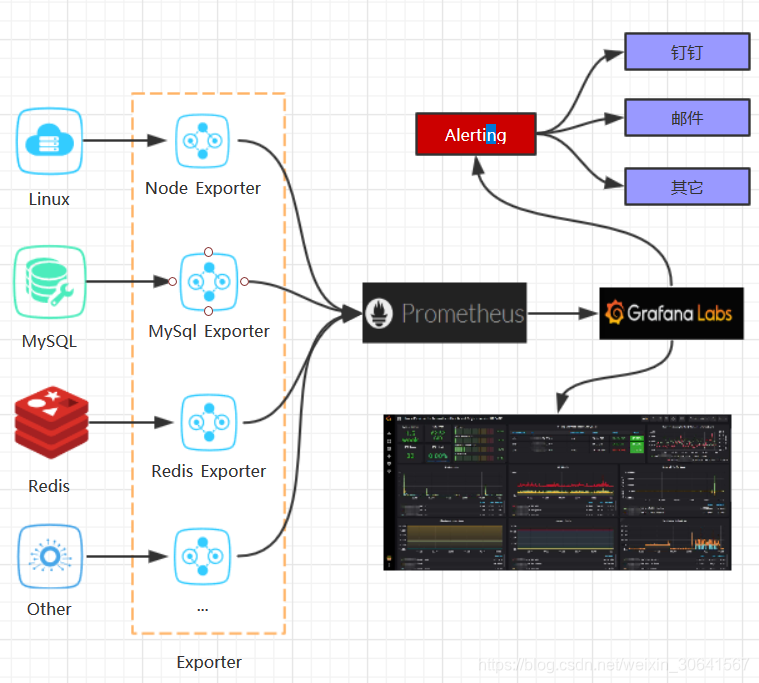
Prometheus是一个开源的服务监控系统,它通过HTTP协议从远程机器收集数据并存储在本地时序数据库上。
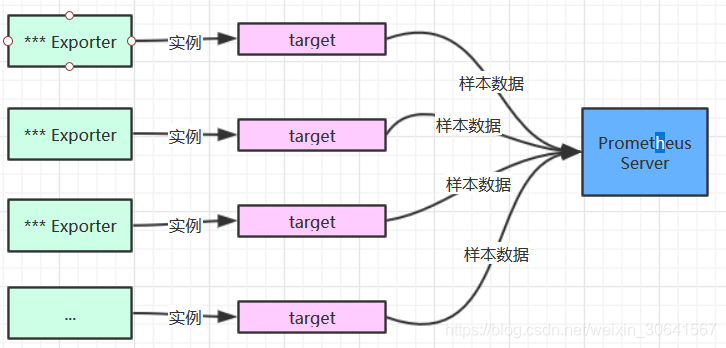
Exporter是向Prometheus提供监控样本数据的程序、Exporter的一个实例称为target,Prometheus通过轮询的方式定期从这些target中获取样本数据。
Grafana是一款用Go语言开发的开源数据可视化工具,可以做数据监控和数据统计,带有告警功能。
一、Prometheus
1.1 下载
官方下载地址:
https://prometheus.io/download/
官方安装文档:
https://prometheus.io/docs/introduction/first_steps/
[root@localhost prometheus]# wget https://github.com/prometheus/prometheus/releases/download/v2.27.1/prometheus-2.27.1.linux-amd64.tar.gz
1.2 解压
[root@localhost prometheus]# tar -zxvf prometheus-2.27.1.linux-amd64.tar.gz
[root@localhost prometheus]# cd prometheus-2.27.1.linux-amd64/
1.3 启动
#后台启动
[root@localhost prometheus-2.27.1.linux-amd64]# nohup ./prometheus &
#查看控制台
[root@localhost prometheus-2.27.1.linux-amd64]# tail -f nohup.out

#优雅停机
[root@localhost prometheus-2.27.1.linux-amd64]# kill -15 pid

#查看9090端口监听,类似netstat命令
[root@localhost prometheus-2.27.1.linux-amd64]# lsof -i:9090
COMMAND     PID USER   FD   TYPE DEVICE SIZE/OFF NODE NAME
prometheu 42314 root    7u  IPv6 215338      0t0  TCP *:websm (LISTEN)
prometheu 42314 root   10u  IPv6 216545      0t0  TCP localhost:38812->localhost:websm (ESTABLISHED)
prometheu 42314 root   11u  IPv6 216546      0t0  TCP localhost:websm->localhost:38812 (ESTABLISHED)
1.4 访问
浏览器请求http://192.168.56.13:9090/
系统默认用户名和密码为admin/admin
1.5 使用帮助
1.5.1 官方使用帮助文档:
https://prometheus.io/docs/prometheus/latest/querying/basics/
As you can gather from http://localhost:9090/metrics, one metric that Prometheus exports about itself is called promhttp_metric_handler_requests_total (the total number of /metrics requests the Prometheus server has served). Go ahead and enter this into the expression console:
promhttp_metric_handler_requests_total
This should return a number of different time series (along with the latest value recorded for each), all with the metric name promhttp_metric_handler_requests_total, but with different labels. These labels designate different requests statuses.
If we were only interested in requests that resulted in HTTP code 200, we could use this query to retrieve that information:
promhttp_metric_handler_requests_total{code="200"}
To count the number of returned time series, you could write:
count(promhttp_metric_handler_requests_total)
For more about the expression language, see the expression language documentation.
二、Exporter
2.1 下载
官方下载地址:
https://prometheus.io/download/
2.2 第三方exporters
https://prometheus.io/docs/instrumenting/exporters/
2.3 node_exporter
2.3.1 解压
[root@localhost prometheus]# tar -zxvf node_exporter-1.1.2.linux-amd64.tar.gz
[root@localhost prometheus]# cd node_exporter-1.1.2.linux-amd64/
2.3.2 启动
#后台启动
[root@localhost node_exporter-1.1.2.linux-amd64]# nohup ./node_exporter &
#查看控制台
[root@localhost node_exporter-1.1.2.linux-amd64]# tail -f nohup.out

#查看9100端口监听,类似netstat命令
[root@localhost node_exporter-1.1.2.linux-amd64]# lsof -i:9100
COMMAND     PID USER   FD   TYPE DEVICE SIZE/OFF NODE NAME
node_expo 44855 root    3u  IPv6 227508      0t0  TCP *:jetdirect (LISTEN)
2.3.3 开机自启
2.3.3.1 创建服务的配置文件
#cat> 文件名 <<eof 是用来创建文件,在这之后输入任何东西,都是在文件里的输入完成之后EOF结尾代表结束
$ cat > /etc/systemd/system/node_exporter.service << EOF
[Unit]
Description=node_export
Documentation=https://github.com/prometheus/node_exporter

[Service]
ExecStart=/home/server/prometheus/node_exporter-1.1.2.linux-amd64/node_exporter
Restart=on-failure
[Install]
WantedBy=multi-user.target
EOF
2.3.3.2 加载服务配置文件
$ systemctl daemon-reload
2.3.3.3 开机自启生效
#增加开机启动
$ systemctl enable node_exporter.service
#移除开机启动
$ systemctl disable node_exporter.service
2.3.3.4 systemctl启停命令
$ systemctl start node_exporter.service
$ systemctl stop node_exporter.service
$ systemctl restart node_exporter.service
$ systemctl status node_exporter.service
2.3.4 浏览器测试
2.4 jmx_exporter
JMX Exporter 利用 Java 的 JMX 机制来读取 JVM 运行时的一些监控数据,然后将其转换为 Prometheus 所认知的 metrics 格式,以便让 Prometheus 对其进行监控采集。
下载地址:https://github.com/prometheus/jmx_exporter
2.5 Prometheus配置添加监控项
[root@localhost prometheus-2.27.1.linux-amd64]# vi prometheus.yml
scrape_configs:
# The job name is added as a label `job=<job_name>` to any timeseries scraped from this config.
- job_name: 'prometheus'
# metrics_path defaults to '/metrics'
# scheme defaults to 'http'.
static_configs:
- targets: ['localhost:9090']
# 添加监控项
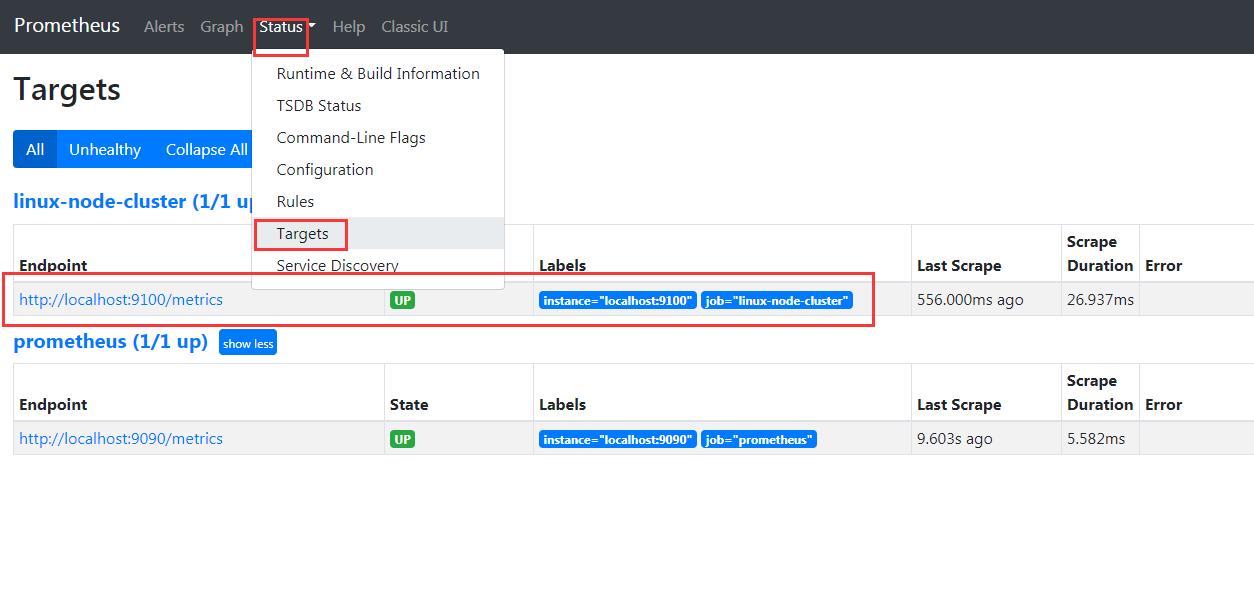
- job_name: 'linux-node-cluster'
static_configs:
- targets: ['192.168.56.13:9100']
2.6 重启Prometheus
[root@localhost prometheus-2.27.1.linux-amd64]# kill -15 42314
[root@localhost prometheus-2.27.1.linux-amd64]# nohup ./prometheus &
三、Grafana
3.1 下载
官方下载地址:
https://grafana.com/grafana/download?pg=get&plcmt=selfmanaged-box1-cta1
官方安装文档:
https://grafana.com/docs/grafana/v7.5/
[root@localhost grafana]# wget https://dl.grafana.com/oss/release/grafana-7.5.7.linux-amd64.tar.gz
3.2 解压
[root@localhost grafana]# tar -zxvf grafana-7.5.7.linux-amd64.tar.gz
[root@localhost grafana]# cd grafana-7.5.7/
3.3 启动
If you installed a binary .tar.gz file, then you need to execute the binary.
Execute the binary
The grafana-server binary .tar.gz needs the working directory to be the root install directory where the binary and the public folder are located.
Start Grafana by running:
#后台启动
[root@localhost grafana-7.5.7]# nohup ./bin/grafana-server web &
#查看控制台
[root@localhost grafana-7.5.7]# tail -f nohup.out

#查看3000端口监听,类似netstat命令
[root@localhost grafana]# lsof -i:3000
COMMAND    PID USER   FD   TYPE DEVICE SIZE/OFF NODE NAME
grafana-s 4595 root    9u  IPv6  45501      0t0  TCP *:hbci (LISTEN)
3.4 访问
浏览器请求http://192.168.56.13:3000/
系统默认用户名和密码为admin/admin
3.5 使用帮助
3.5.1 DashBoard组成
Dashbord组成如下图:
- 一个dashbord由多个row组成。
- 一个row由1~n个panel组成。
- 一个panel可以一个graph、table等。
3.5.2 官方DashBoard模板
https://grafana.com/grafana/dashboards
3.5.3 官方使用帮助文档:
https://grafana.com/docs/grafana/latest/getting-started/getting-started/
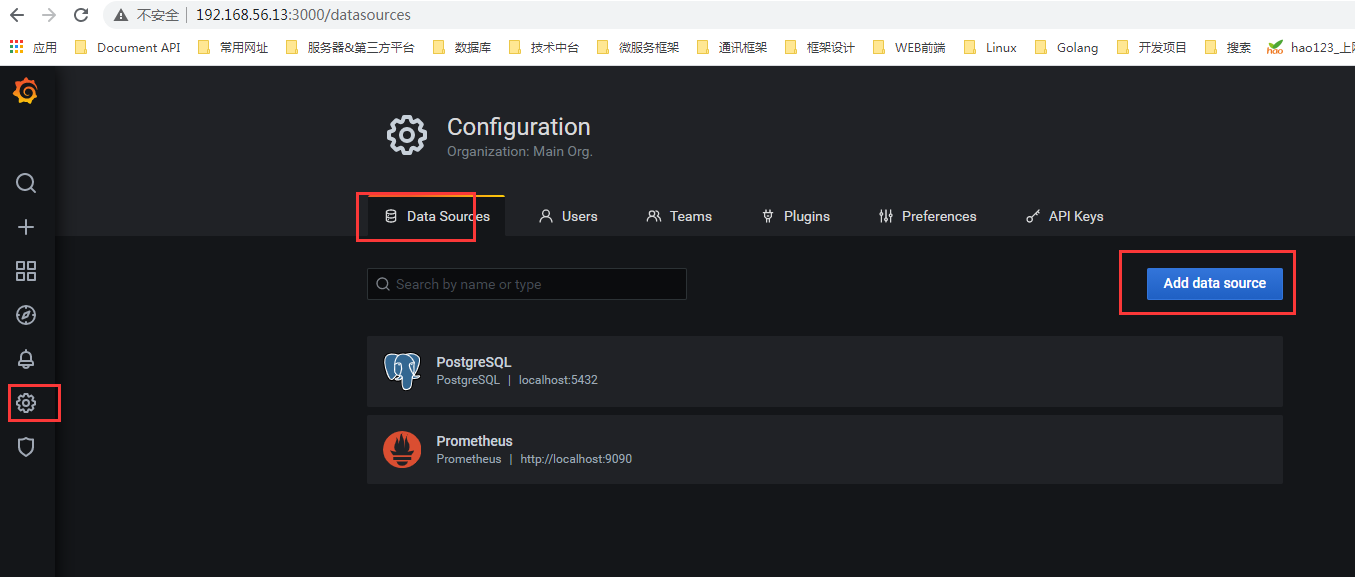
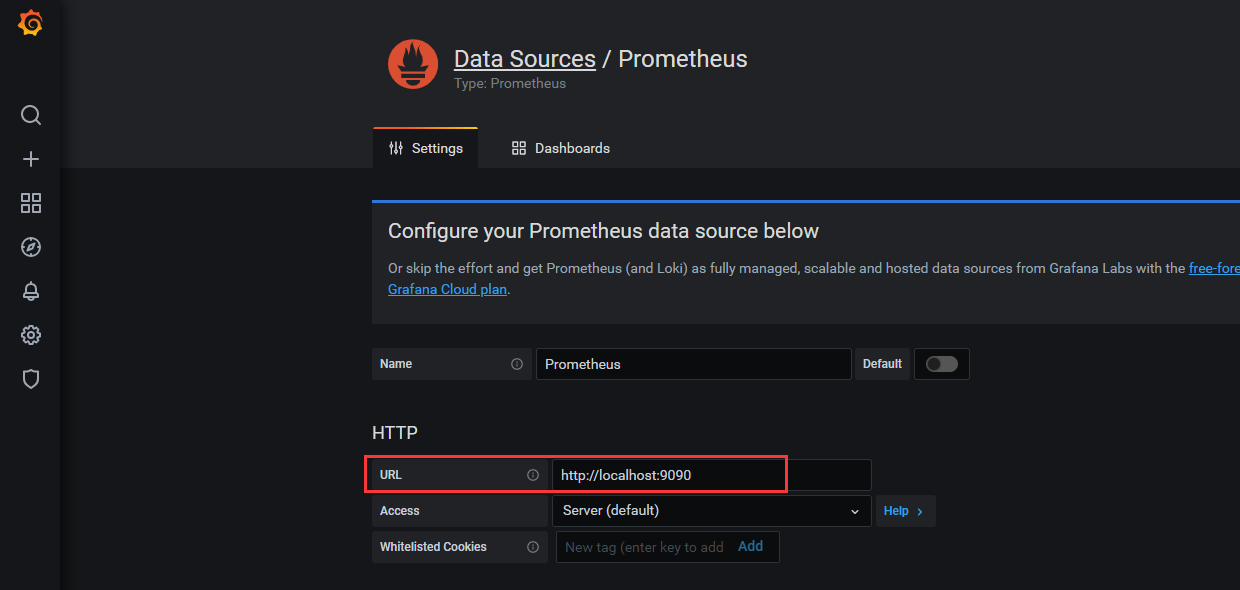
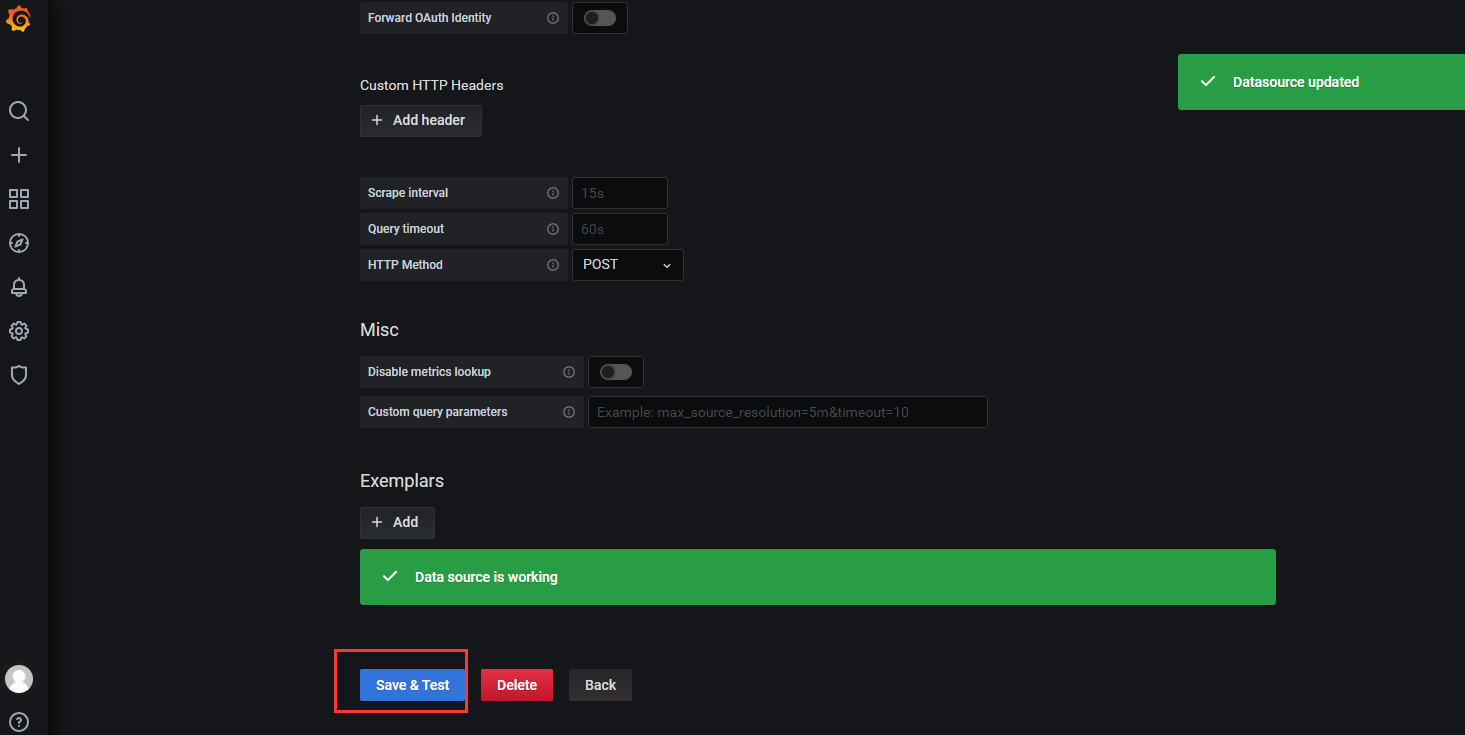
3.6 连接Prometheus
Configuration->Data Sources->Add data source
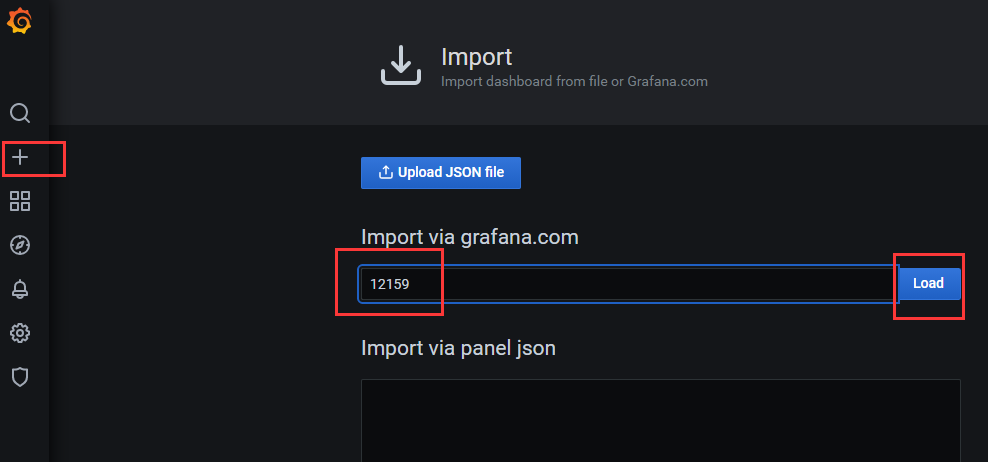
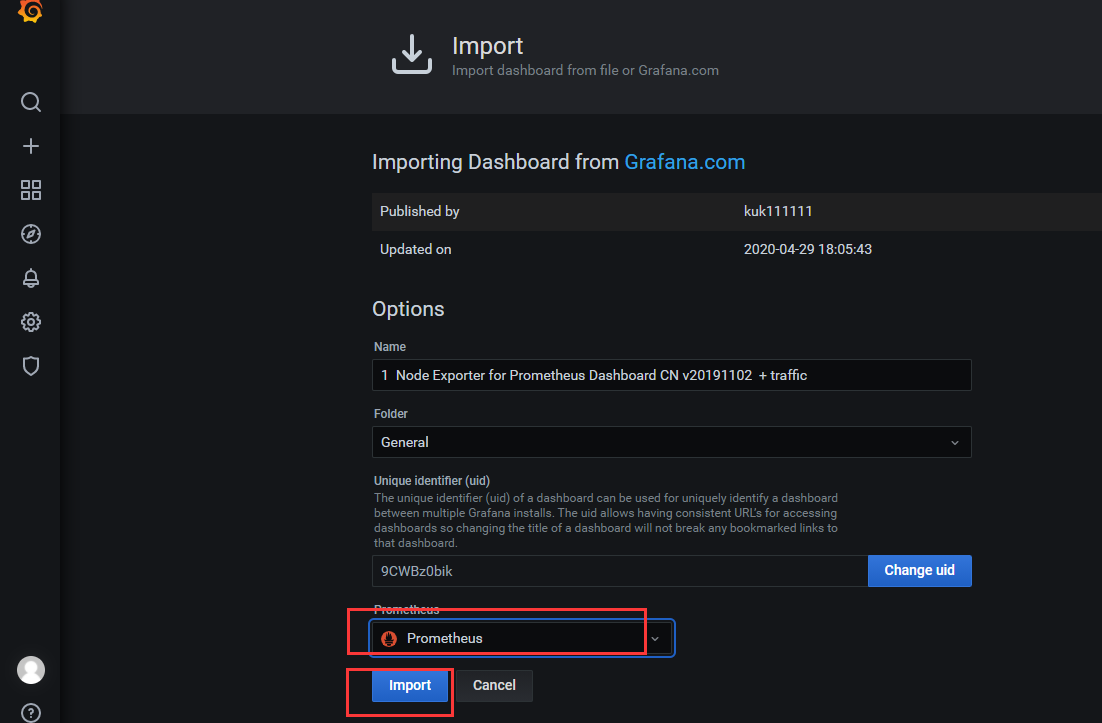
3.6 使用DashBoard模板
导入DashBoard模板
修改模板信息

 浙公网安备 33010602011771号