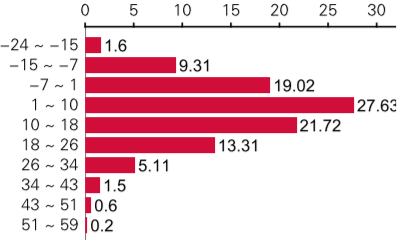
JFreeChart 零散
*
主要是dynamicreports 和 jfreechart结合的时候,进行的一些配置:
1,移除legend的黑色边框
LegendTitle legend = chart.getLegend();
        //legend.setFrame(new BlockBorder(Color.green));
        if(legend!=null){
            legend.setFrame(BlockBorder.NONE);//去除legend的黑线框
        }
2,图的方向调换,
.setOrientation(Orientation.HORIZONTAL)

3,在dynamic-reports中客制化jfreechart
private class AxisLineCustomizer implements DRIChartCustomizer, Serializable {
        private static final long serialVersionUID = 1L;

        @Override
        public void customize(JFreeChart chart, ReportParameters reportParameters) {
            BarRenderer renderer = (BarRenderer) chart.getCategoryPlot().getRenderer();
            CategoryPlot categoryPlot=chart.getCategoryPlot();
            categoryPlot.setRangeGridlinesVisible(false);//数据区的网格线删除

            //chart.getLegend().setFrame(BlockBorder.NONE);//去除legend的黑边框
            LegendTitle legend = chart.getLegend();
            //legend.setFrame(new BlockBorder(Color.green));
            if(legend!=null){
                legend.setFrame(BlockBorder.NONE);//去除legend的黑线框
            }

            CategoryAxis domainAxis = categoryPlot.getDomainAxis();
            categoryPlot.setRangeZeroBaselineVisible(true);//显示出0的线
            domainAxis.setAxisLineVisible(false);//不显示x轴的线
            domainAxis.setTickMarksVisible(false);//不显示x轴的标尺

            renderer.setNegativeItemLabelPosition(new ItemLabelPosition());
            ValueAxis valueAxis=(ValueAxis) chart.getCategoryPlot().getRangeAxis();
            categoryPlot.setDomainAxisLocation(AxisLocation.BOTTOM_OR_LEFT);
            //domainAxis.setInverted(true);//数据轴倒过来
            //categoryPlot.setOrientation(PlotOrientation.VERTICAL);
        }
    }
4,xy轴的标签
//.setCategoryAxisFormat(cht.axisFormat().setLabel("一万个理由"))//x轴标签
.setValueAxisFormat(cht.axisFormat().setLabel("(%)"))//y轴标签
*5,.setUseSeriesAsCategory(true)

*
更多属性设置,参考 JFreeChart中文API
*
*
备注:公众号清汤袭人能找到我,那是随笔的地方
备注:公众号清汤袭人能找到我,那是随笔的地方


 浙公网安备 33010602011771号